.png)
2nd in the Swiss Super League, qualified for Europe, and won the Swiss Cup for the first time in 26 years.

St.Gallen had a clear game model and individual development points. The problem is the one every club knows: measuring all of that, week after week, is time-consuming and often gets overlooked
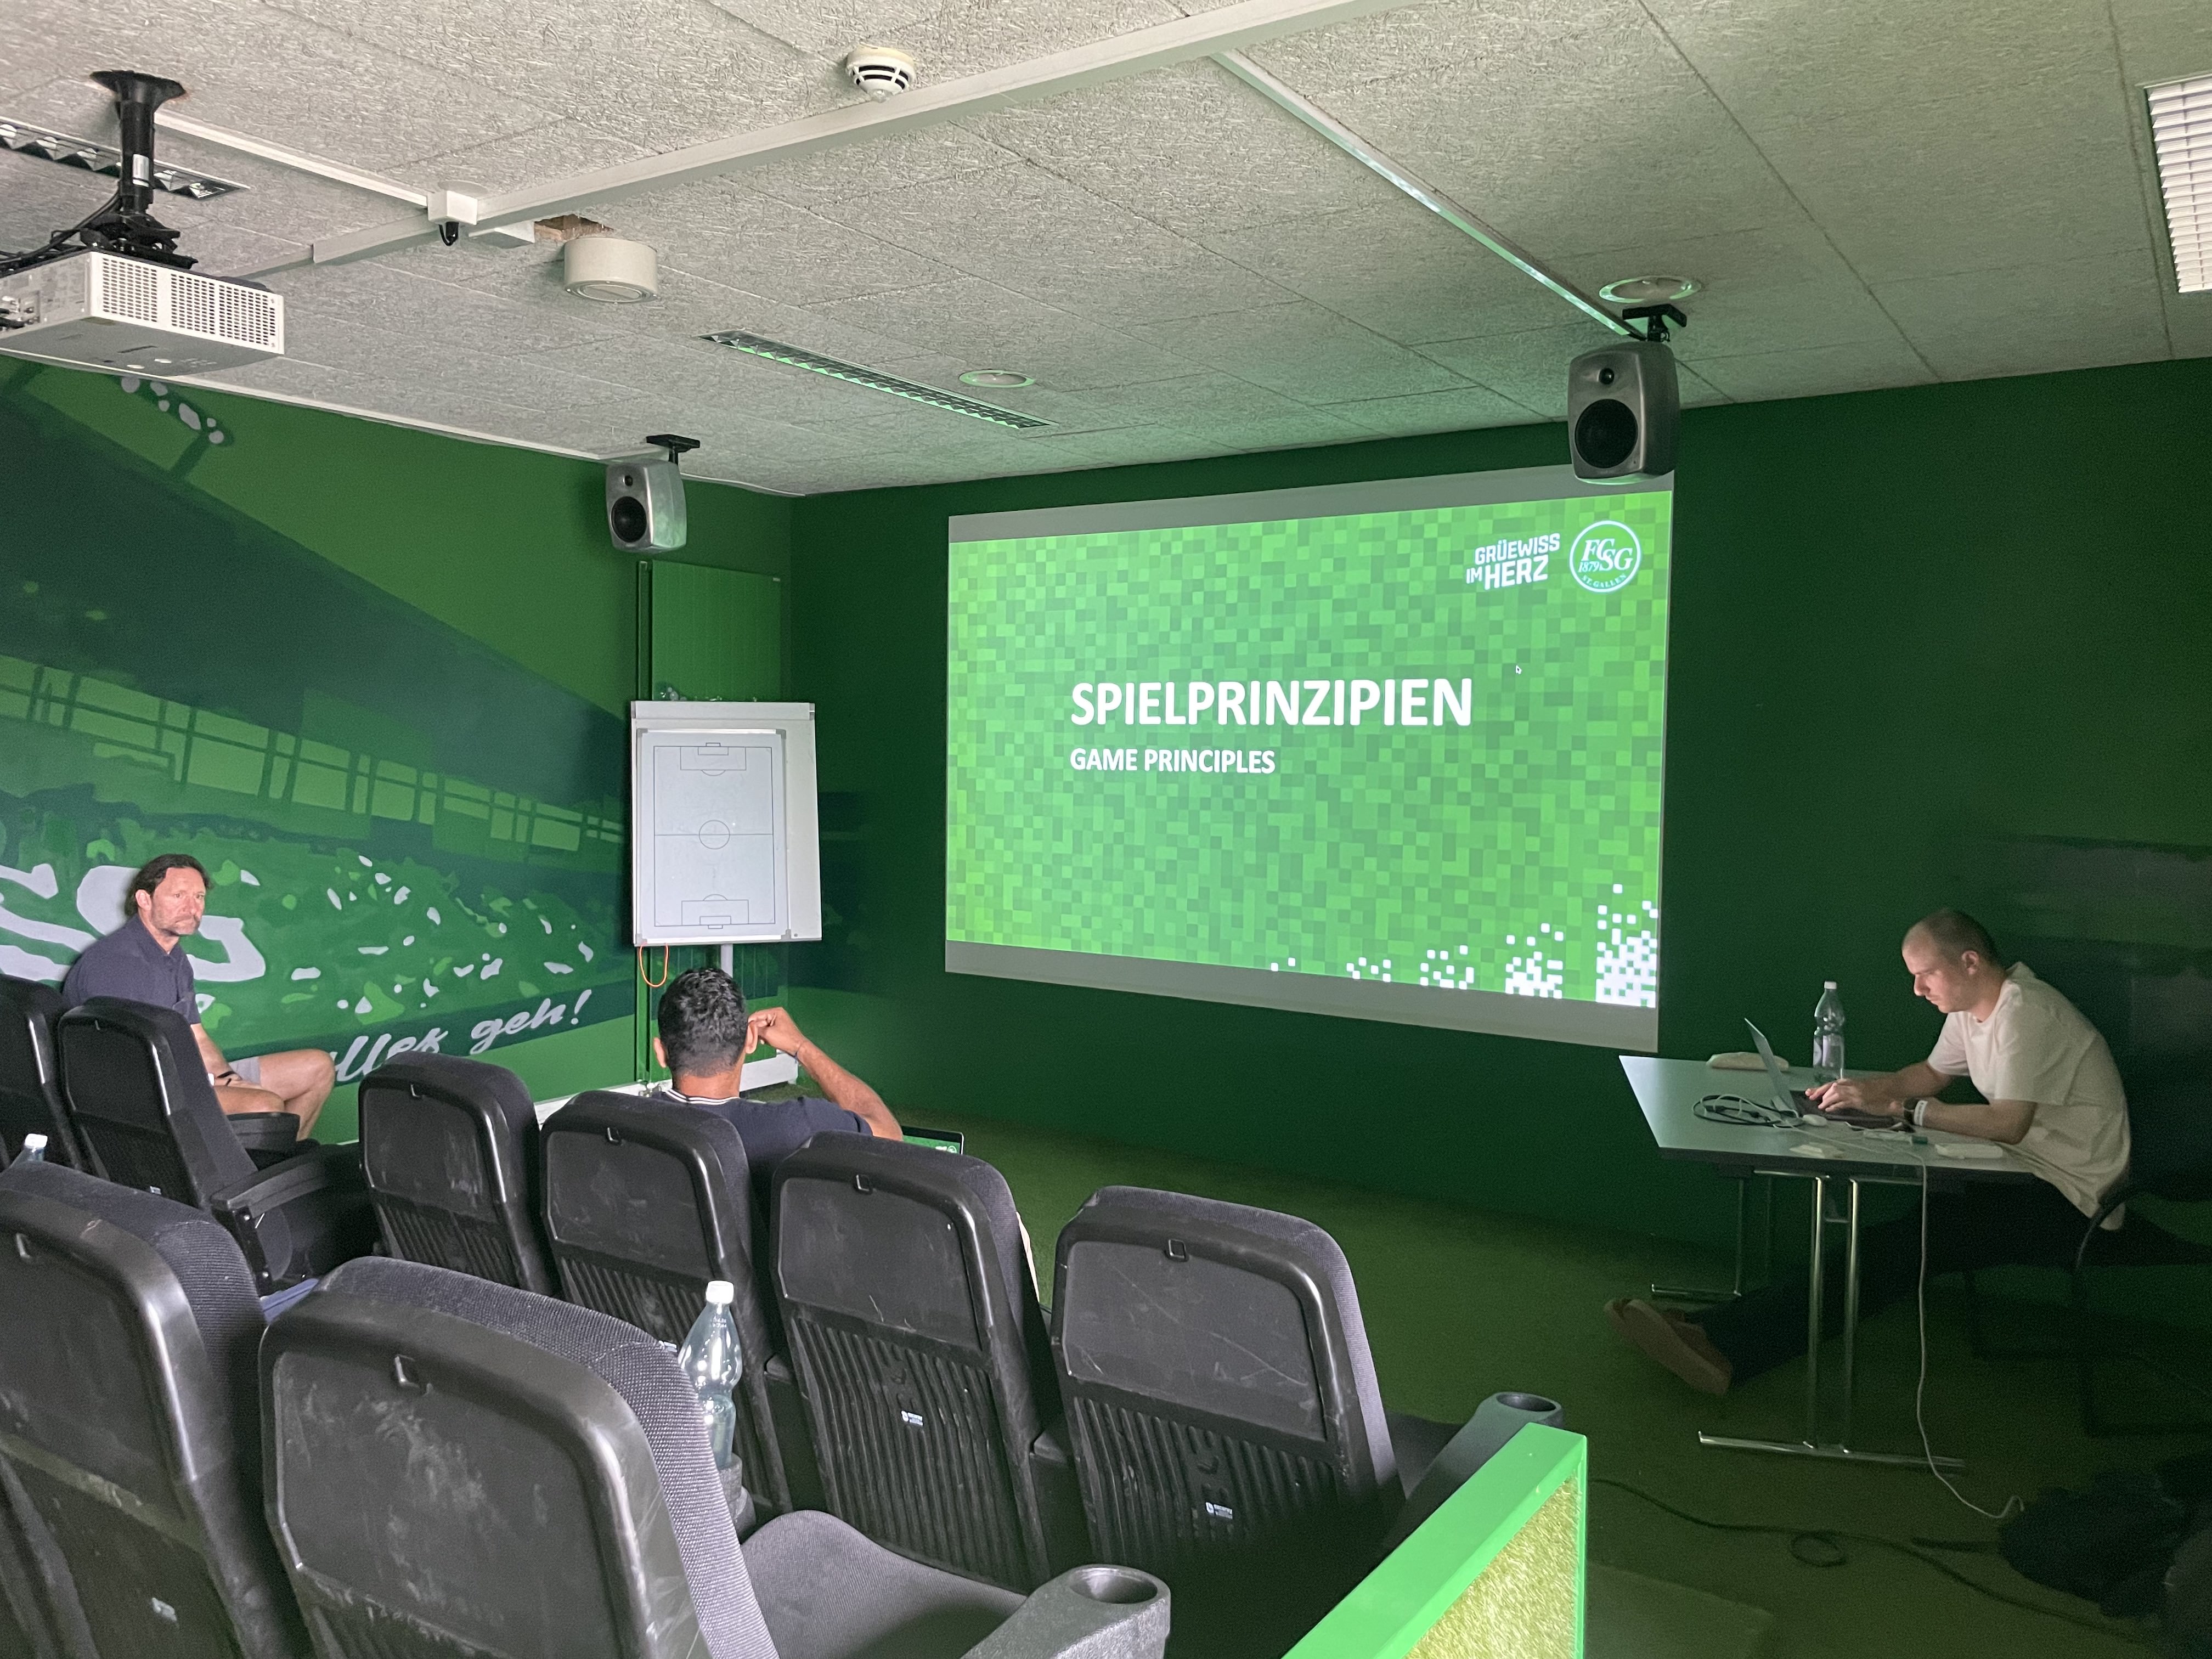
Last summer we ran a workshop with their coaching staff, where they walked us through their game model and their principles, on a team level and individual level. We set up with their custom metrics so they could track every week inside MyGamePlan. Then the season did the talking.
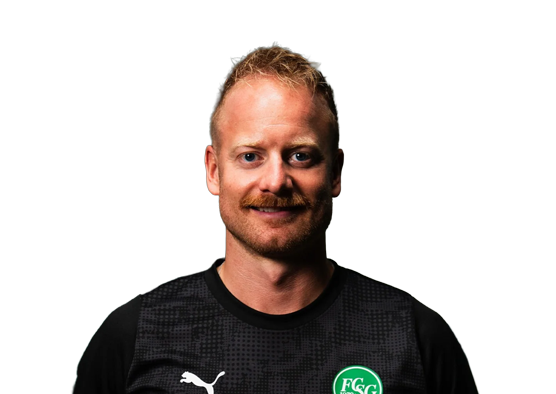
"The on-site workshop with MyGamePlan gave us immediate structure. In just a few days, our game model was mapped and our player profiles linked to individual development plans."
.png)
Jonas Maier
Video‑Analyst, FC St. Gallen







Fewest lines broken through the centre by opponents. Nobody made it harder to play through them.
Most shots and most metres carried after winning the ball. They hurt teams the moment possession turned.
Fewest shots and fewest final-third entries conceded after an opponent's transition. When they lost the ball, they rarely got punished for it.
Submit your workflow and get access to your automated platfrom.
Start for FreeSee how tracking data, event data and video come together in one workflow.
Book a demo
Several players improved across the season, but Christian Witzig stood above all. He produced the league's clearest upward progression on two specific metrics the coach asked for: defensive pressing runs and runs into the final third.
The interesting thing is that these was built custom to the player based on his role within the team. Both trended up week by week, and finished well above the league benchmark.