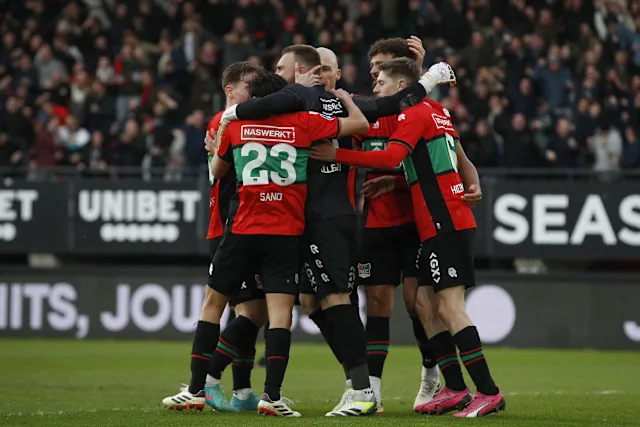
Highest ever Eredivisie finish (3rd) & first ever Champions League qualification.
So how did they do this?
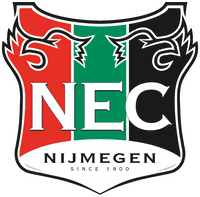
From the outside, N.E.C. Nijmegen's season looks like a surprise. The numbers that defined their year are not the ones sitting next to xG and possession. They are the club's own principles, coached every week and measured match after match.
At MyGamePlan, we take the principles of a coach and make them trackable, week by week, with the video behind every number. So a season like NEC's stops looking like a surprise and starts looking like a plan. The clubs that climb the table are rarely the lucky ones. They are the ones who decided exactly what they wanted to be, and then measured whether it was true.


Won the most second balls in the entire league. Their press was structured and co-ordinated to retrieve possession.
Most crosses to the box of any Eredivisie team, with an average of 6 players in the box per cross. That figure is top in the world, not just the league.
Best transition-to-shot and transition-to-goal ratio in the Eredivisie. When the ball was won, they were able to exploit the opponent.
Fewest opponent build-ups reaching final third, and least balls reaching the assist zone. Third fewest shots conceded in the whole division.
"Having performance data and video in the same environment changes how we work. I can go from the numbers to the clips in seconds, which means the conversations with coaches are faster and more focused on what actually matters us."
Robin Huntjens
Performance & Video Analyst, NEC Nijmegen
You will not find "second balls won after a long goal kick" or "players in the box per cross" in the standard metric list. These are the staff's own principles, defined in their own language and tracked, with the video moment behind every one. That is a game model: a clear idea of how to play, coached every week until it becomes who the team is.
If your club has a clear idea of how it wants to play but no clean way to see whether it shows up on the pitch, that is the gap we close. Book a demo with MyGamePlan.
Submit your workflow and get access to your automated platfrom.
Start for Free