.png)
Every week, analysts spend hours coding the same actions. With MyGamePlan, your tagging runs automatically, while exactly matching your structure and how your club sees the game.
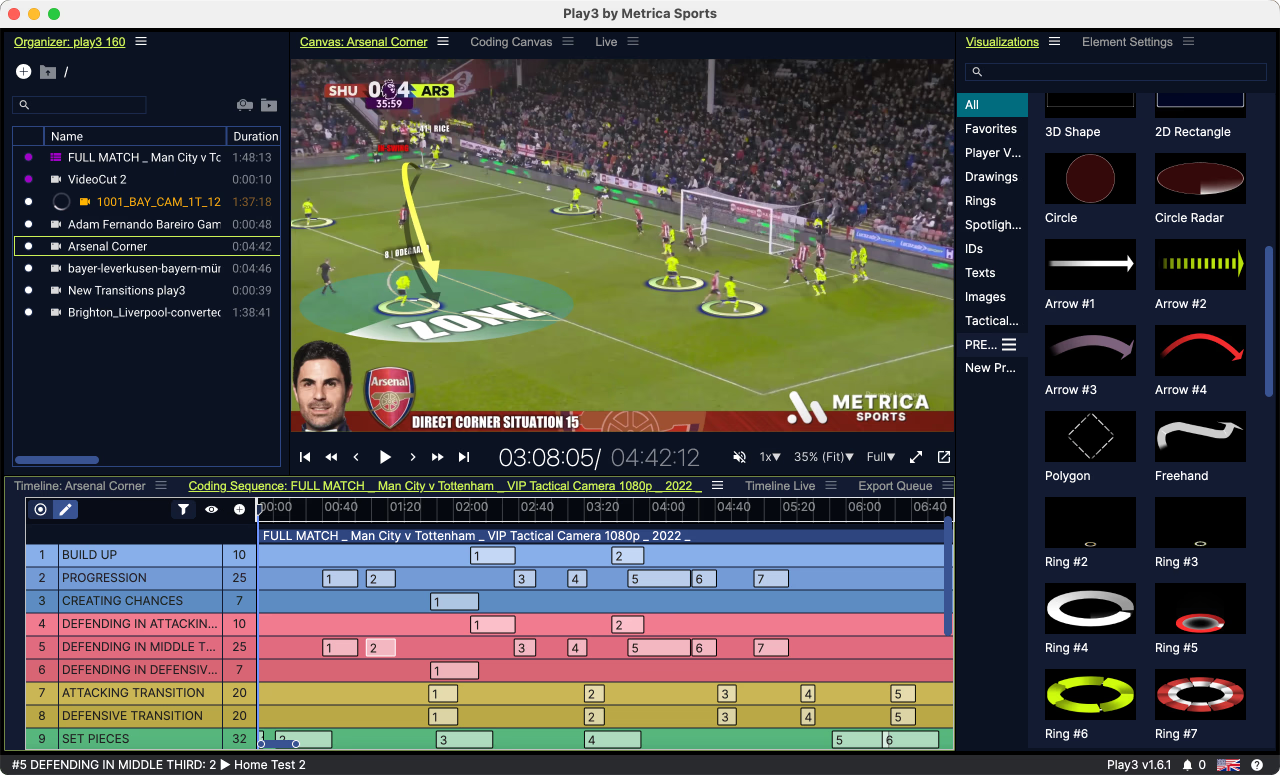
Tagging is how analysts break down a match into something measurable: you mark every moment that matters (a press trigger, a build-up pattern, a set piece, a transition) and link each tag to a moment of video.
Tagging automation removes that manual step. Your structure is defined once, then applied automatically to every game: for your team, players, and opponents. Now you get the same tagged, video-linked dataset, without the hours spent building it.

Manually tagging has a few limitations. It is labour intensive to go in-depth, so the finer detail never gets captured. MyGamePlan removes that ceiling, by automatically tagging all the specifics you care about.
Secondly, the analysis usually stops at two or three games per opponent which is a limited sample size. Automate this process means you can read patterns across a whole season, from the games that are actually relevant.
Tagging was done manually for one reason: every analyst tags in their own unqiue way, that is custom to their clubs playing philosophy. No generic engine could replicate that, so analysts had to spend hours coding every match by hand.
MyGamePlan changes the starting point. Our custom metric engine can capture the data model of each club, and rebuild the complete analysis structure without missing any detail. Once the structure is set - we can run automatically.
Our AI custom metric engine captures your tagging structure, in your exact definitions, and applies it automatically across every match.
Send an XML export, a screenshot of your coding window, or an internal report. That shows us the metrics and actions that matter to your club.
Our custom metric engine recreates your entire tagging structure inside MyGamePlan, in your definitions. Not a template. Yours.
Every past and future match gets tagged the same way, with no manual work. Every tag is linked to video.
Pull auto-tagged XML in your own structure, or export tagged clips straight into the video tool you already use.
Setup takes under 24 hours, and everything stays fully editable. Change a metric whenever your thinking changes.
Our engine syncs match event with context from tracking data, so your categories can go as deep as your you want. Pick a phase of play to see the difference.
We do not give generic events. Our output is an XML file that reflects exactly how your club analyzes the game. It is built custom to your structure, with every tag connected to broadcast and tactical video.
Our XML matches your existing structure, so with one-click you can import every game of your next opponent, straight into the tools you already use without changing your workflow.




Hear from analysts who got back valuable hours back for thinking, interpretation, and supporting strategic decisions.

.png)
Jim Smit
Video Analyst, FC Volendam


Antoine Turi
Assistant Coach, La Louvière


Chris Heuvelmans
Performance & Video Analyst, VVV Venlo


Juan Giuffra
Chief Analyst, Independiente del Valle
How does MyGamePlan create metrics custom to my analysis?
We've built a rule engine that takes in the context of your tagging and style of play into account. We don't believe in general reports and default metrics, MyGamePlan will only provide insights, data and video about the principles that you care about, the player's strengths and weaknesses that are important for you and the opponent insights you want to benefit from.
What data sources does MyGamePlan use?
We combine any event data provider, with any tracking data provider with any video (broadcast and tactical)
What modules does MyGamePlan have?
Team performance, where you analyse your own game model based on your principles of play. Player Development where you can track the progress of your players, based on the metrics and principles that you think are important. Opponent Analysis where you can create custom metrics and xml files your next opponent and recruitment where you can find and analyse players that match your exact player profiles you are looking for.
Can MyGamePlan connect to tactical footage for analysis?
Yes, we have an automated integration with most tactical video providers so you don't have to manually download, upload and manage any offset no more.
Does MyGamePlan also provide a download in an xml file?
Yes, our XML files are generated every game based on your custom tags.
Is MyGamePlan only available for professional clubs?
No, if you have clear video footage and match sheets of each available game we can start, amateur and academy teams can use MyGamePlan.