MyGamePlan automates your opponent and team tagging. With our Metrica Nexus integration, a one-click export means your time goes into what actually helps win games.

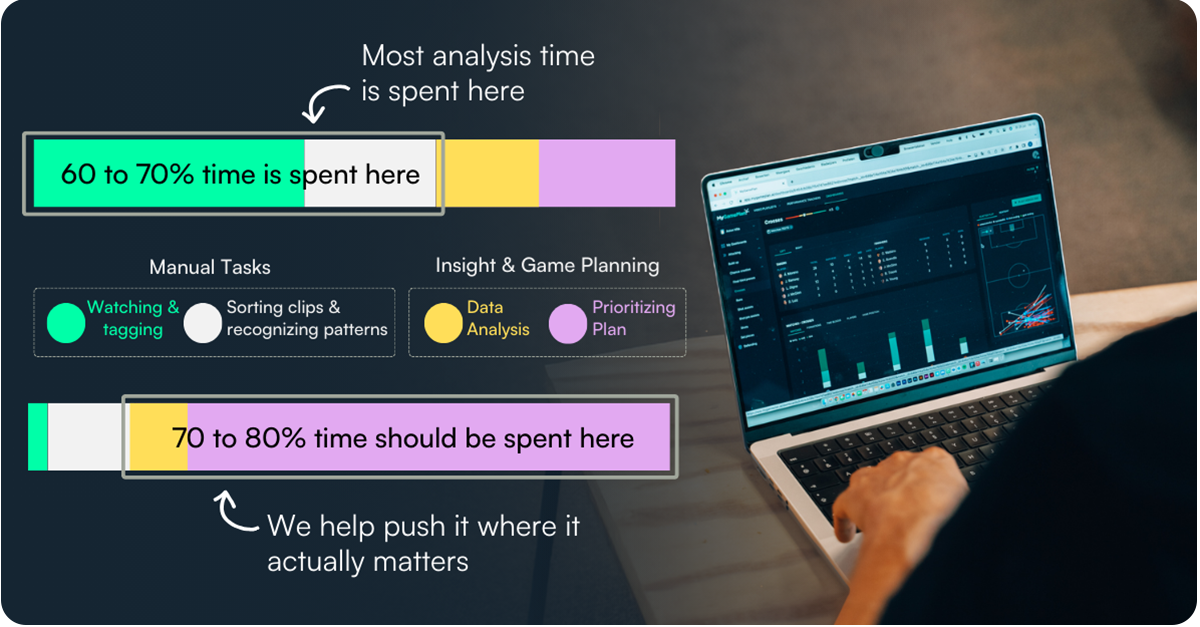
Manual tagging is closer to data entry than to analysis. But it's where most of the analyst's week disappears.
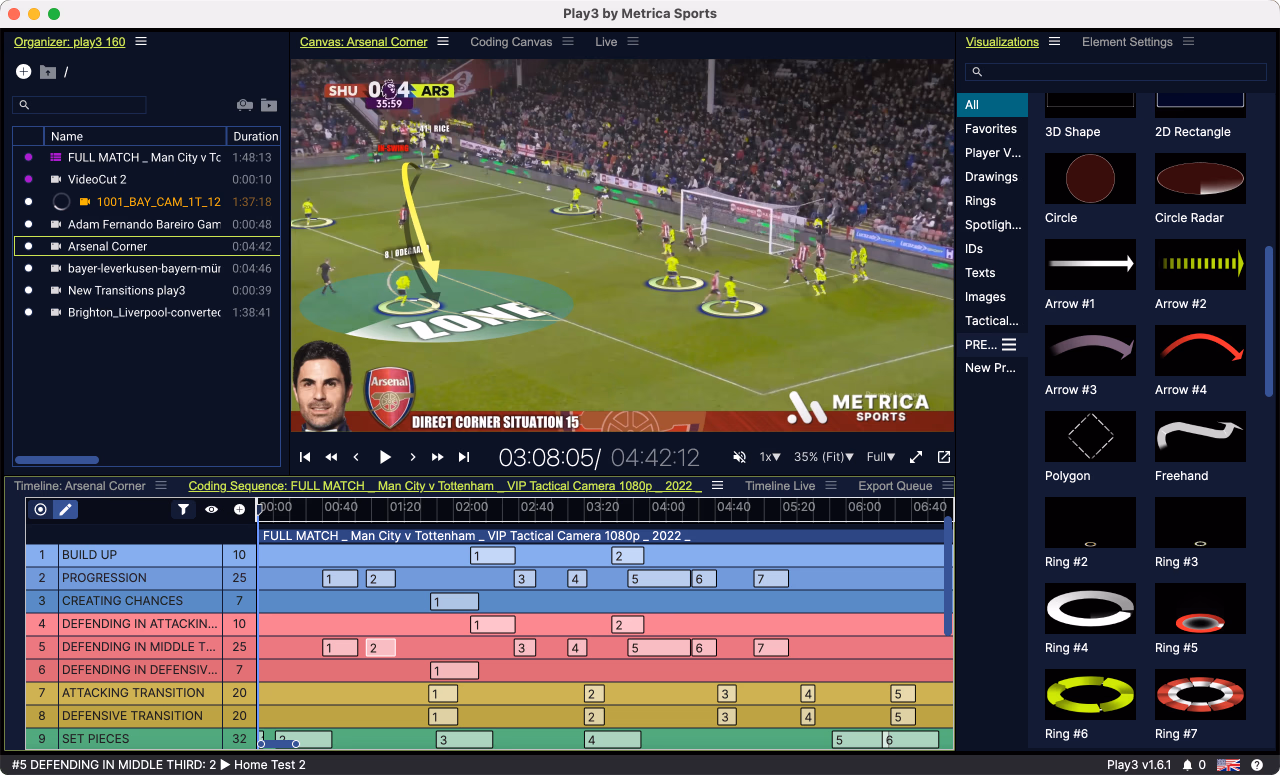
Metrica Nexus is built for what comes after: elite-level telestration, communication, and presentation that turns analysis into something coaches and players can act on. But before you open Nexus, you're stuck coding the same events and categories, game after game.
MyGamePlan flips that. We rebuild your tagging structure once, then run it automatically across every match, for your team, players and opponents, so the time you spend in Nexus goes into analysis, not admin.

Stop tagging the same events every week and focus on things that actually matter
Define your tagging categories in MyGamePlan — your team's principles, opponent patterns, set pieces, transitions, whatever matters.
MyGamePlan applies your tagging structure automatically across every match in your archive. New games get tagged the same way, consistently, without any manual work.
When you are ready to prepare for a game, export your tagged clips directly to Metrica Nexus with one click. No manual file handling, no setting offsets.
Open Nexus with a fully tagged, organised dataset. Spend your time selecting the right clips, building telestrations, and creating presentations for your coaches and players.
.jpg)

"With MyGamePlan, the time we used to spend on manual work now goes into the analysis itself. We set up our structure once and get exactly what we need for every game, automatically."
Juan Giuffra
Chief Analyst, Independiente del Valle
Connect your workflow and automate
your tagging today.
See how automated tagging and one-click XML export work together end-to-end.
Book a demoManual tagging was necessary to capture the specific way your club analyzed the game. But analysts had to spend most of their time tagging, which meant that the deeper part of their work - interpretation, framing, timing, and decision support, got less space than it deserved.
MyGamePlan's AI custom metric engine can capture all your tags in exactly your definition. So every past and future game is automatically tagged and ready without any manual work.
Our XML is not a generic file that is provided by other tools - and you can fully customize it in your structure. Once you import it into Nexus, you can win back hours and spend them on more strategic analysis work.
How does MyGamePlan create metrics custom to my analysis?
We've built a rule engine that takes in the context of your tagging and style of play into account. We don't believe in general reports and default metrics, MyGamePlan will only provide insights, data and video about the principles that you care about, the player's strengths and weaknesses that are important for you and the opponent insights you want to benefit from.
What data sources does MyGamePlan use?
We combine any event data provider, with any tracking data provider with any video (broadcast and tactical)
What modules does MyGamePlan have?
Team performance, where you analyse your own game model based on your principles of play. Player Development where you can track the progress of your players, based on the metrics and principles that you think are important. Opponent Analysis where you can create custom metrics and xml files your next opponent and recruitment where you can find and analyse players that match your exact player profiles you are looking for.
Can MyGamePlan connect to tactical footage for analysis?
Yes, we have an automated integration with most tactical video providers so you don't have to manually download, upload and manage any offset no more.
Does MyGamePlan also provide a download in an xml file?
Yes, our XML files are generated every game based on your custom tags.
Is MyGamePlan only available for professional clubs?
No, if you have clear video footage and match sheets of each available game we can start, amateur and academy teams can use MyGamePlan.
.jpeg)

.png)