Metric Breakdown

Break any metric into every layer, in one prompt

More power and flexibility in creating your custom metrics

Ask MGPT

Built in seconds by our AI Assistant

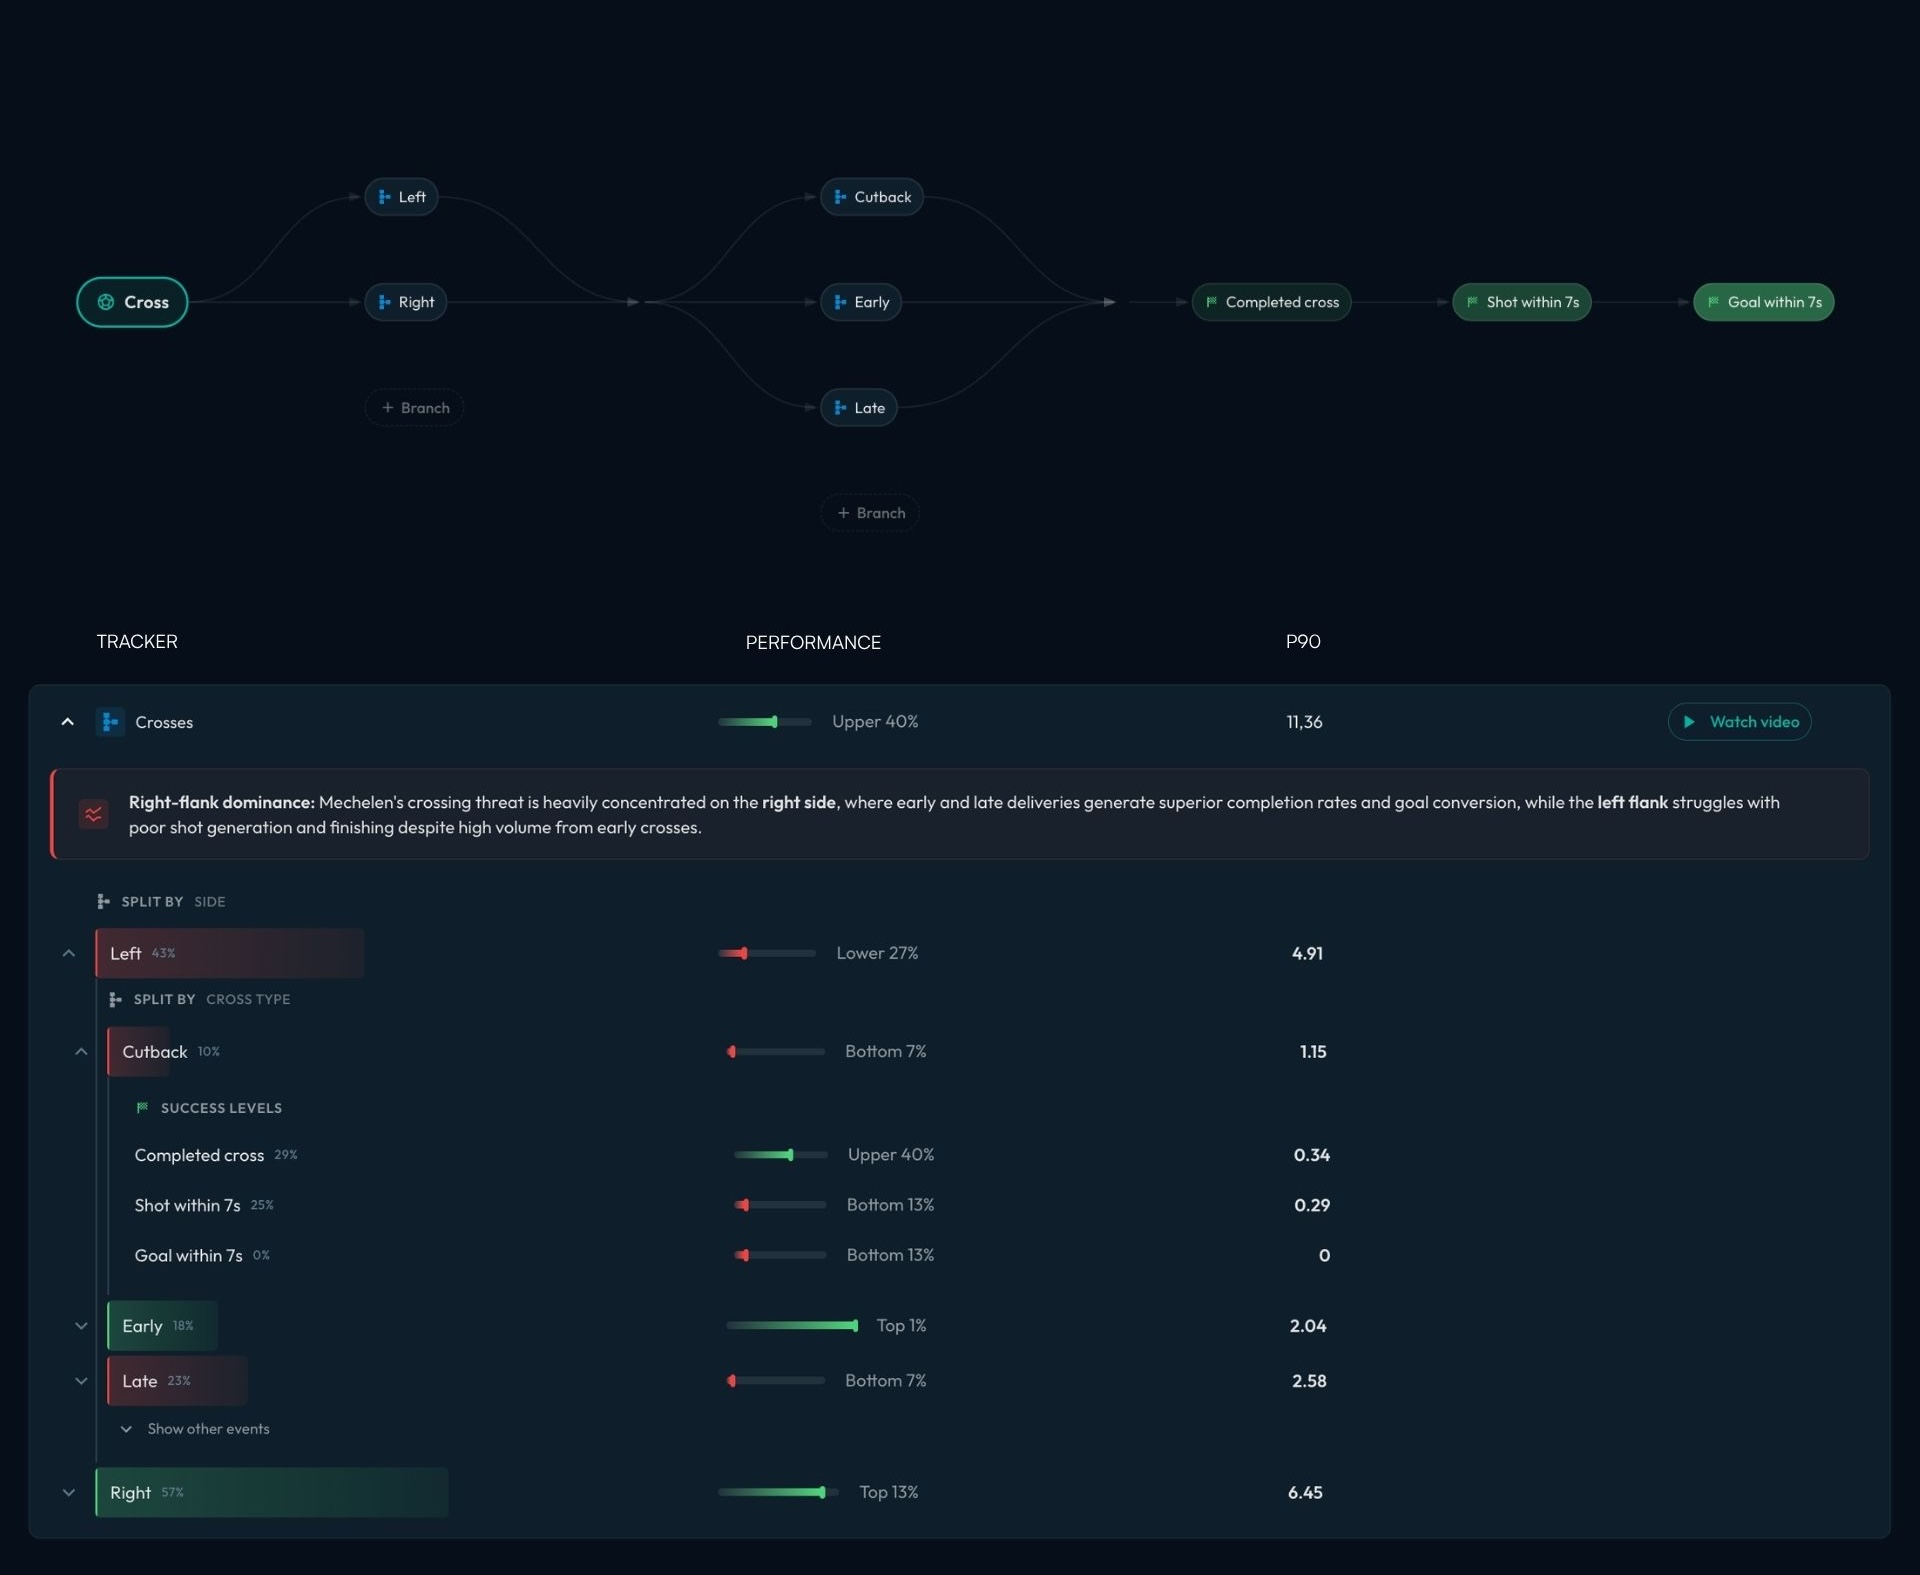
MyGamePlan has pushed automated analysis, and our new metric breakdown update takes it further. Instead of tagging every cross and then labelling each one by side, delivery and outcome, you can runs the whole expansion from one prompt.

Describe the breakdown you want in plain language, and MGPT builds every metric in one go. Hours of work can now be done in seconds.

Person using a laptop displaying a sports analytics dashboard with player stats, charts, and a soccer field graphic.
Why it couldn't be done before

Go as deep as your analysis

Ask for crosses split by side (left and right), then by how they were delivered within each side (early, late, cutback), then by what they led to within each of those (completed, a shot, a goal). That is two sides, three deliveries and three outcomes, so one prompt returns eighteen metrics, each a full combination such as a left-sided cutback that led to a goal.

Ask for crosses split by side (left and right), then by how they were delivered within each side (early, late, cutback), then by what they led to within each of those (completed, a shot, a goal). That is two sides, three deliveries and three outcomes, so one prompt returns eighteen metrics, each a full combination such as a left-sided cutback that led to a goal.

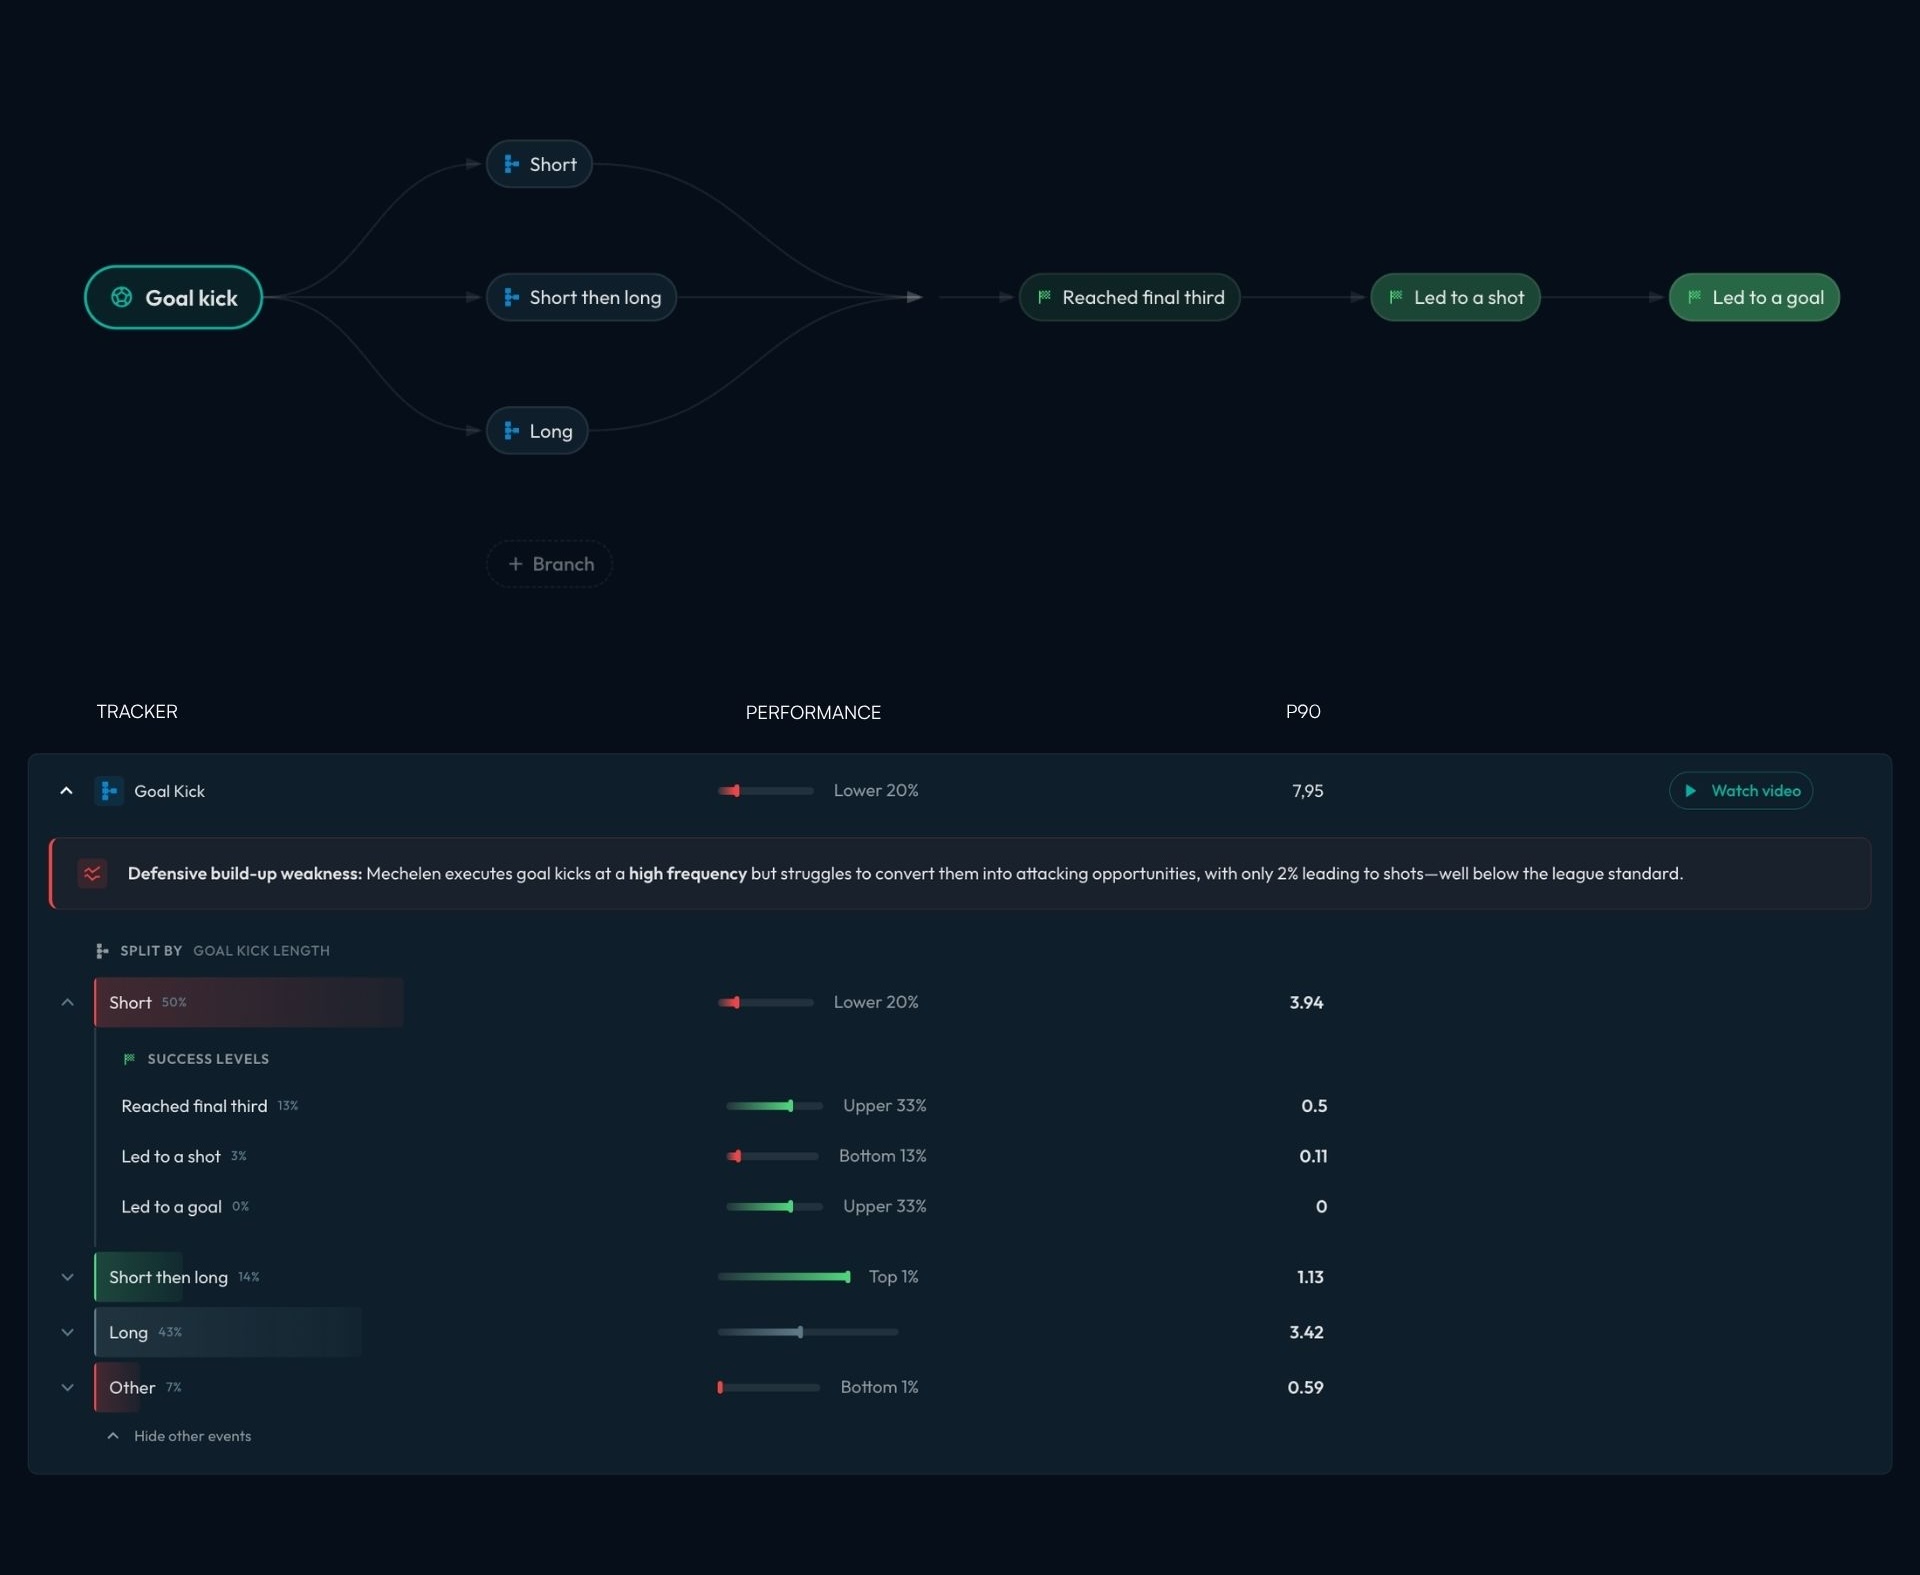
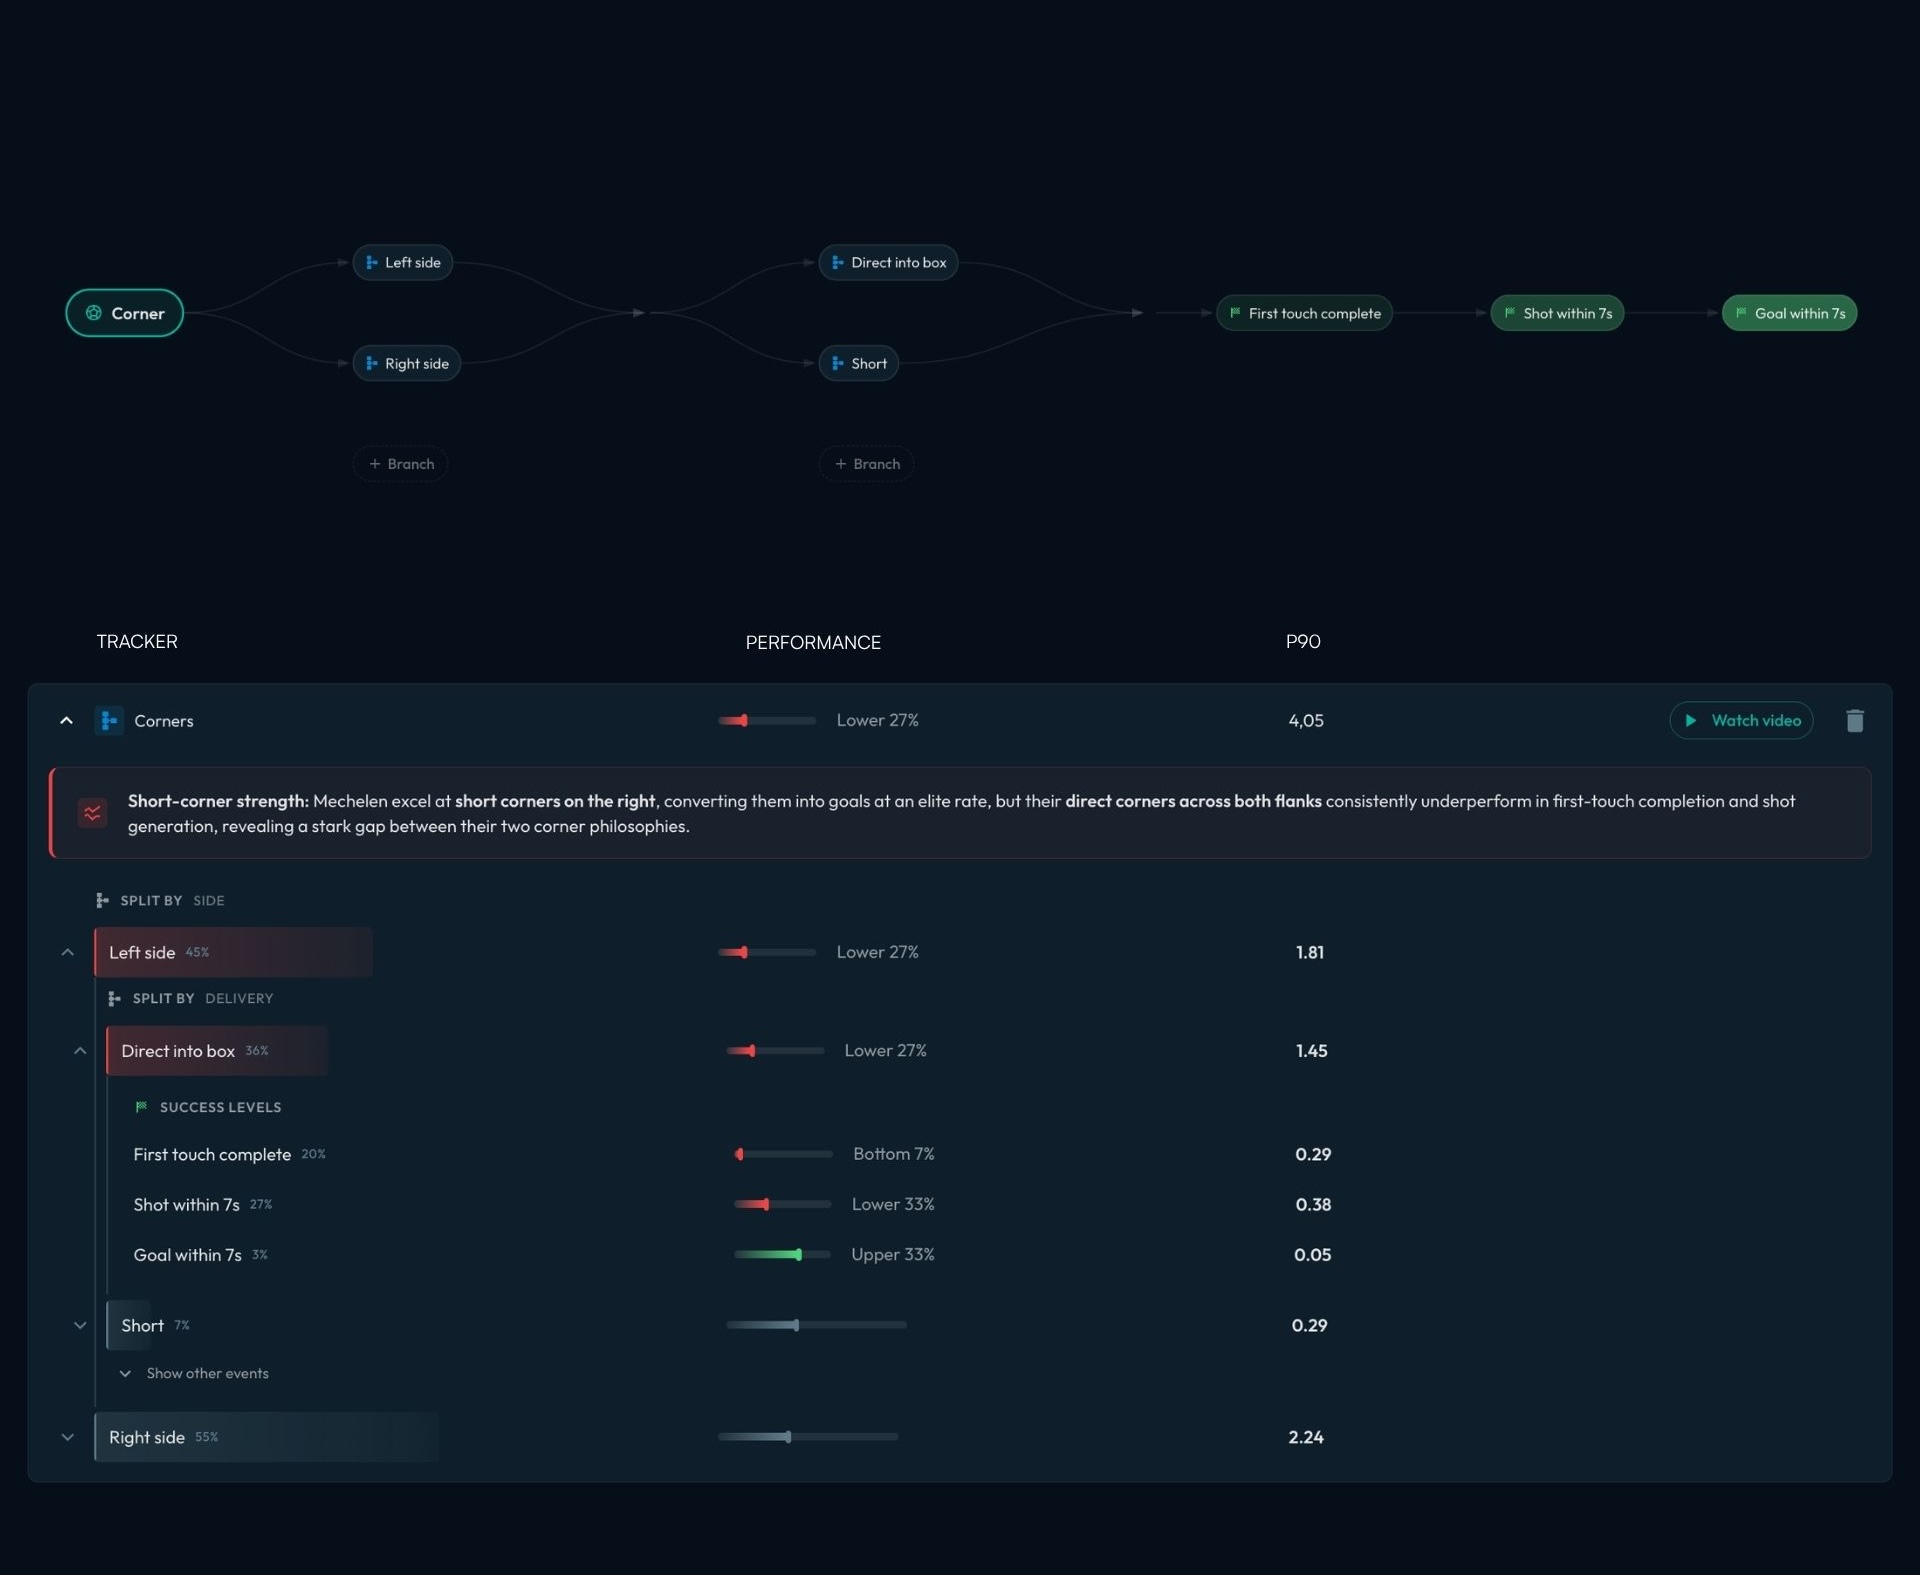
You can do the same for goal kicks, set-pieces, build-up, and anything you track. Choose the layers that match how you read the game, and MGPT builds the metrics to match

The basics

Get all events linked to your XML

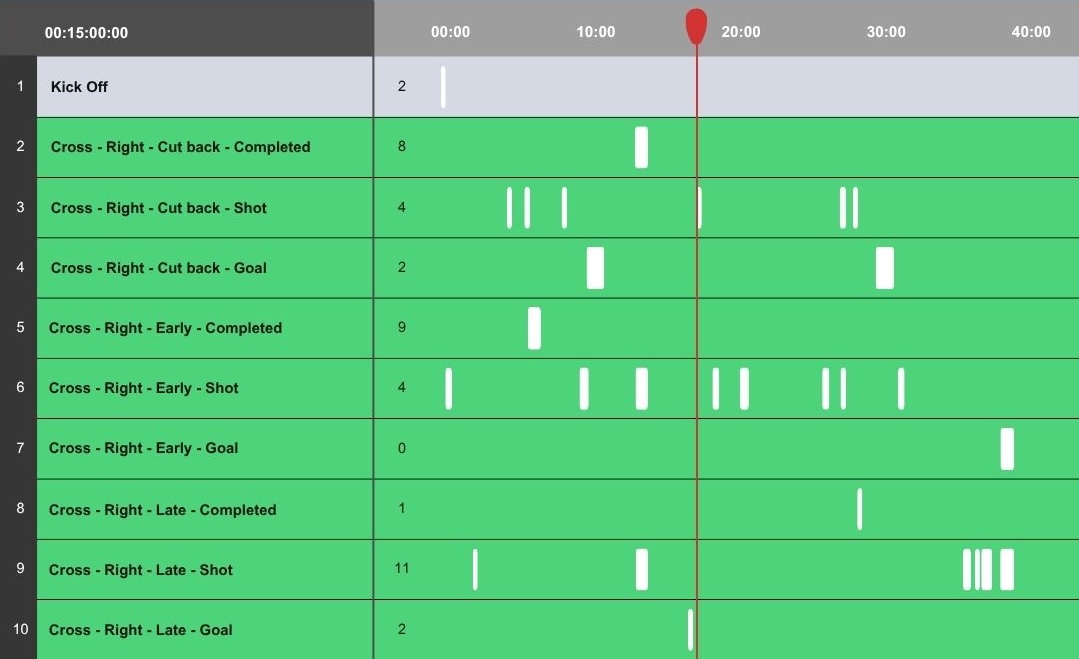
Every metric MGPT builds lands in your XML, ready for the way you already prepare. Export it and the whole breakdown is there, layer by layer, so your pre-match coding picks up exactly the splits you asked for.

Users can choose to show each success level and breakdown as a separate row in your XML, and also add them as labels.

White letter S centered on a rounded square orange background.Black stylized 'M' with a white circle on a green gradient background.Abstract white winged shape with three stripes on black square background.White geometric polygonal network design on an irregular orange background shape.
Person using a laptop displaying a sports analytics dashboard with player stats, charts, and a soccer field graphic.
FAQ

Frequently asked questions

How does MyGamePlan create metrics custom to my analysis?

+

We've built a rule engine that takes in the context of your tagging and style of play into account. We don't believe in general reports and default metrics, MyGamePlan will only provide insights, data and video about the principles that you care about, the player's strengths and weaknesses that are important for you and the opponent insights you want to benefit from.

What data sources does MyGamePlan use?

+

We combine any event data provider, with any tracking data provider with any video (broadcast and tactical)

What modules does MyGamePlan have?

+

Team performance, where you analyse your own game model based on your principles of play. Player Development where you can track the progress of your players, based on the metrics and principles that you think are important. Opponent Analysis where you can create custom metrics and xml files your next opponent and recruitment where you can find and analyse players that match your exact player profiles you are looking for.

Can MyGamePlan connect to tactical footage for analysis?

+

Yes, we have an automated integration with most tactical video providers so you don't have to manually download, upload and manage any offset no more.

Does MyGamePlan also provide a download in an xml file?

+

Yes, our XML files are generated every game based on your custom tags.

Is MyGamePlan only available for professional clubs?

+

No, if you have clear video footage and match sheets of each available game we can start, amateur and academy teams can use MyGamePlan.

Tag football the way you coach it

Dashboard showing team performance with spider chart, individual player Jobe Bellingham's development card highlighting crossing skill, and a mobile screen displaying final third passes statistics including total events, season average, and event details with option to watch videos and scatter plot visualization.