
Event and tracking data on their own can already provide meaningful insights for football analysts, data scientists, and fans. But by combining event data with tracking data, we can go much deeper.
In this post, we showcase how to detect relative pitch zones directly from raw tracking data, without relying on predefined roles or static pitch grids.
Step 1: Cluster players into positional lines
Players (excluding the goalkeeper) are clustered along the length of the pitch (x-axis) using k-means with exactly three clusters.
These clusters are then ordered by their mean position, resulting in a back-to-front line structure:
- Defenders
- Midfielders
- Attackers
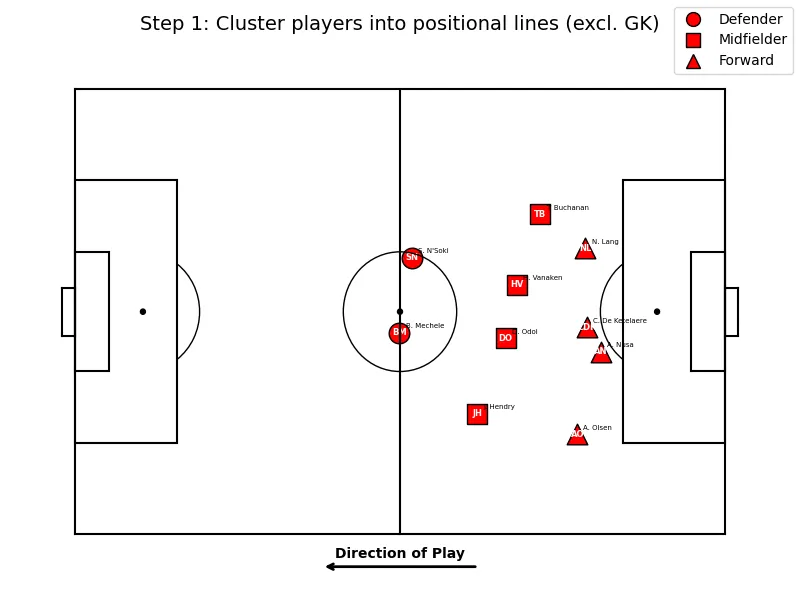
This approach:
- allows a variable number of players per line
- captures the team’s dynamic spatial organization
- avoids rigid role-based labels (e.g. left back, centre back)
In other words, positions emerge from where players actually are, not where they’re supposed to be.
Step 2: Define Zones
Depth zones (along the length of the pitch)
Using the average position of each line, we define four relative zones:
- Behind the defensive line (defined by the last defender — i.e. the minimum x-position)
- Between defense and midfield
- Between midfield and attack
- Before the strikers: (defined by the most advanced attacker — i.e. the maximum x-position)
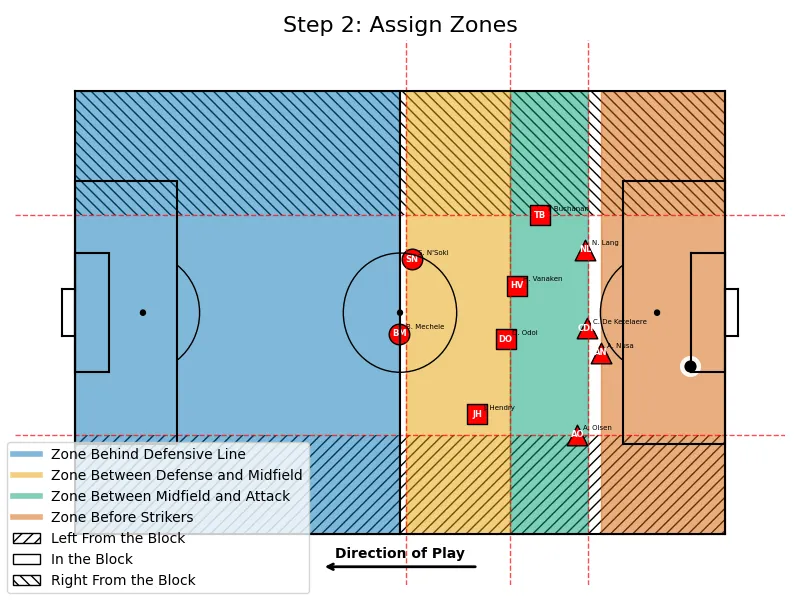
Width zones (across the width of the pitch)
Using the minimum and maximum lateral positions of all opponent players, we define three zones:
- Left of the block
- In the block
- Right of the block
*All zones are relative to the opponent’s current structure.
Result
By combining depth and width we get 4 × 3 = 12 dynamic, relative zones.
Want to see this in action?
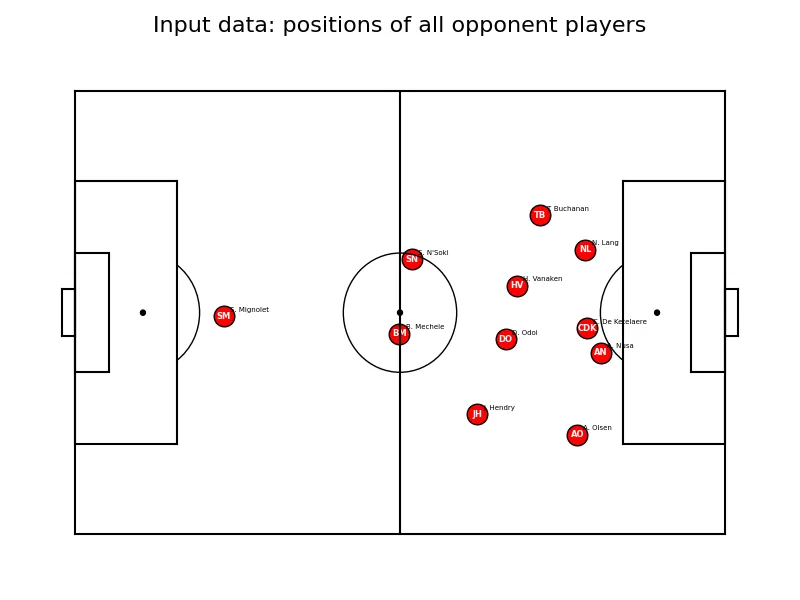
We visualized the Club Brugge vs Anderlecht (1–1) match on 22/05/2022, using tracking data powered by SkillCorner.
.jpg)