Turning post-match review and development into daily player habit

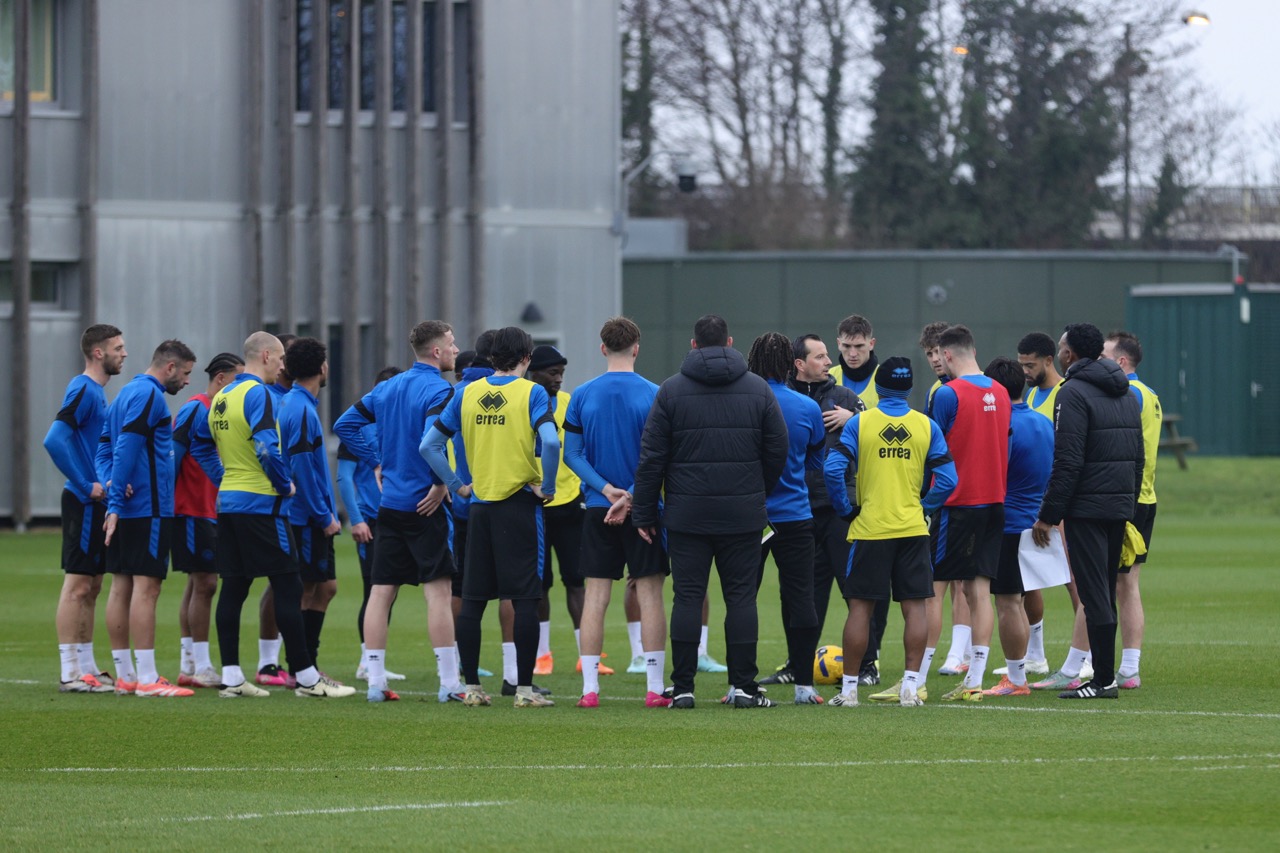
The English Championship produces a schedule where a squad can play twice inside five days for weeks at a stretch. For analysts and individual development coaches trying to extract meaningful learning from each game, the window between the final whistle and the next kick-off is tight.
At QPR, the question was how to make individual development genuinely continuous, rather than something confined to a meeting room. Players needed to access and engage with it at every point of the week.
Staff now spend their time on the quality of analysis, not the logistics. The biggest time saver has been removing the production layer entirely.
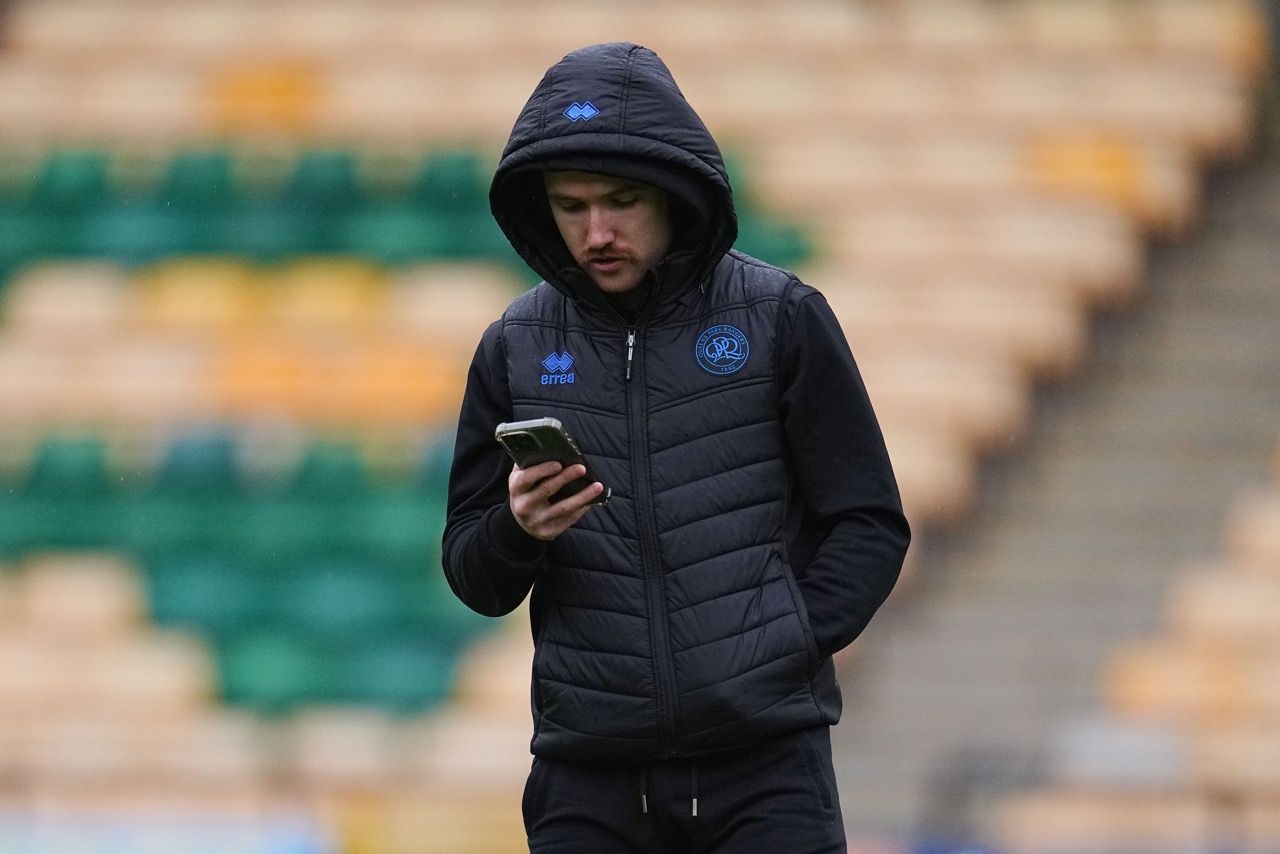
Players check their clips and IDP progress before any coaching session. The rhythm of individual development runs through every day of the week.
Custom metrics, position-specific targets, and the clips that explain them. Every development plan is tailored to their role.
Individual Development Coach, Kevin Betsy joined QPR with a clear philosophy: players who understand their own game, who can look at data and footage and draw their own conclusions, develop faster and with more genuine buy-in than players who simply receive instructions.
The QPR development process starts with alignment. The analysis team, led by Saul Hemingway, works with the coaching team to identify the areas of each player's game that need to develop, anchored to the club's positional profiles. From there, the relevant metrics are built from scratch inside MyGamePlan, tailored to each player's position, their targets, and their current trajectory.
"The improvement in players understanding of opponents and their engagement with their own clips from training and games. That has been the biggest change."
For each fixture, QPR's coaching staff build a clip package focused on the specific players each QPR player will face. These are targeted clips illustrating the patterns each player will most likely encounter, not general highlight reels.
For a wide forward that Mbengue will mark, that means footage showing what spaces they can rotate into, their preferred foot in one-v-one situations, and the zones they target from wide crosses. Mbengue watches that content before the team meeting. He arrives having already formed his own picture of the opponent.
.jpg)
"I like to watch the opponent forwards when we are preparing for the game. It is important for me to see how they use the ball in 1v1 attacking situations and which foot they use the most when they are looking to dribble and shoot. Also, from crosses, which space they like to attack."
For right back Amadou Mbengue, one tracked metric monitors how often he performs a pressure action within five seconds of an opponent completing a line-breaking pass into the right third of the pitch. It is the kind of reactive defensive trigger that separates well-positioned full-backs from those who get caught.
After a game, Mbengue opens the app to go back through his clips, then cross-references his working points to see how his metrics compare to where they were the week before. By the time Mbengue sits down with Kevin, he has already formed his own reading of the game. Kevin can ask more pointed questions and have a conversation rather than a briefing.

.jpeg)
It is a culture that runs to the top of the squad. QPR captain Jimmy Dunne was named MyGamePlan's Player of the Month for January, an award recognising the highest engagement on the app across all partner clubs, for his consistency in reviewing his own footage and studying upcoming opponents.