Opponent analysisTeam reportSeason reportTactical concept

See how they build from the back.

Every build-up they start, followed third by third: the shape they build in from tracking, the side they go, where it is lost, and how it holds against a high, mid or low block, ranked against the rest of the league.

Watch the full report ↗

Opens the real report on open data: Club Brugge, Belgian Pro League 2021/22. No account needed.

The prompt behind it

Break down Club Brugge's build-up in open play: the shape they build in, the side they go, and where they lose the ball.

Change a word and you get a different report. Same template, your question.

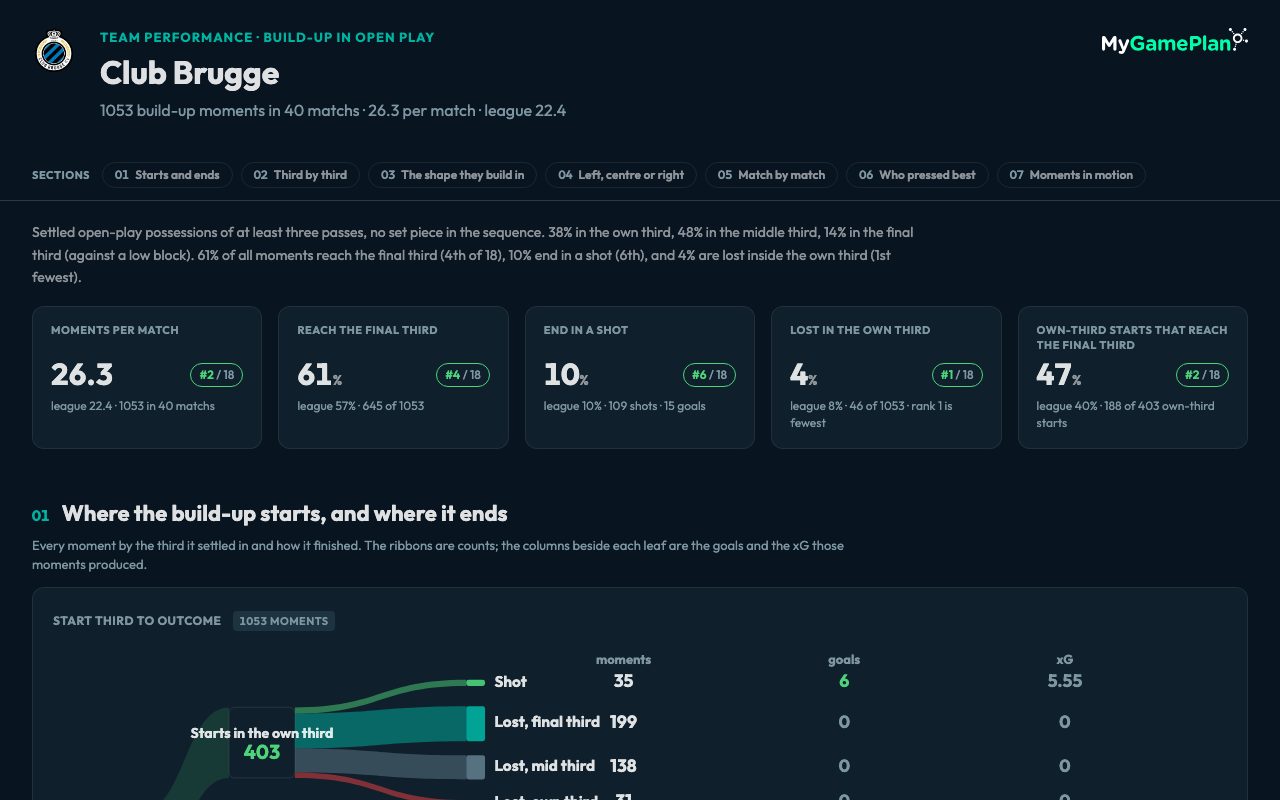
app.mygameplan.ai/try/build-up-in-open-playOpen ↗Build-up in open play, the first screen of the real report on Club Brugge

The report, section by section

Six sections, the way this template is written today.

Scroll down. Every number here is the real report's, on Club Brugge 2021/22, and the report itself is one click away, behind Watch the full report. Keep these six, cut the ones you never read, or prompt for another.

01

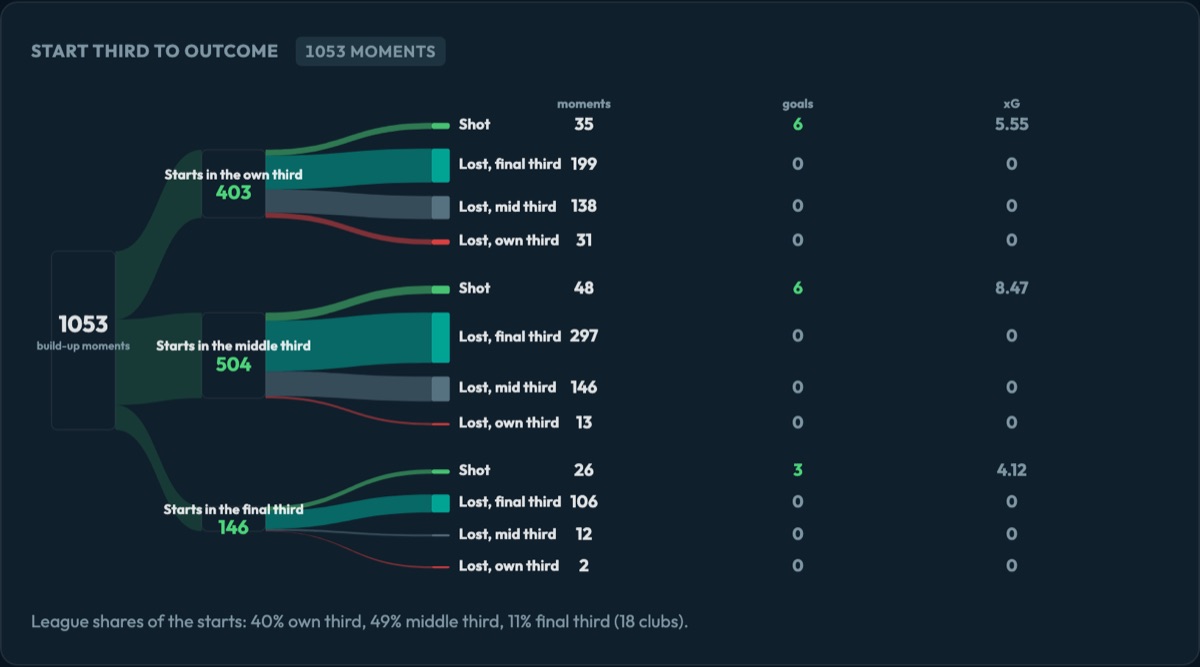
Start third to outcome

1053 moments: the ribbons are counts, the columns are goals and xG

Ribbon chart of Club Brugge's 1053 build-up moments, split by the third they start in and how they end, with goals and xG per ending

01 · Starts and ends

Every build-up, from where it settles to how it finishes.

A build-up moment is a settled open-play possession of at least three passes, with no set piece in it. Club Brugge have 1053 in 40 matches, 26.3 a match against a league 22.4, second of 18. 403 settle in their own third, 504 in the middle third and 146 in the final third, and 109 end in a shot, for 15 goals.

The goals and the xG sit beside each ending, so you see at once which starting point pays. The 504 that settle in the middle third give 48 shots and 8.47 xG, against 35 shots and 5.55 from the own-third starts. That is where their possession becomes dangerous, and where your plan starts.

02

Every move between thirds

Percentages are of the visits to that third

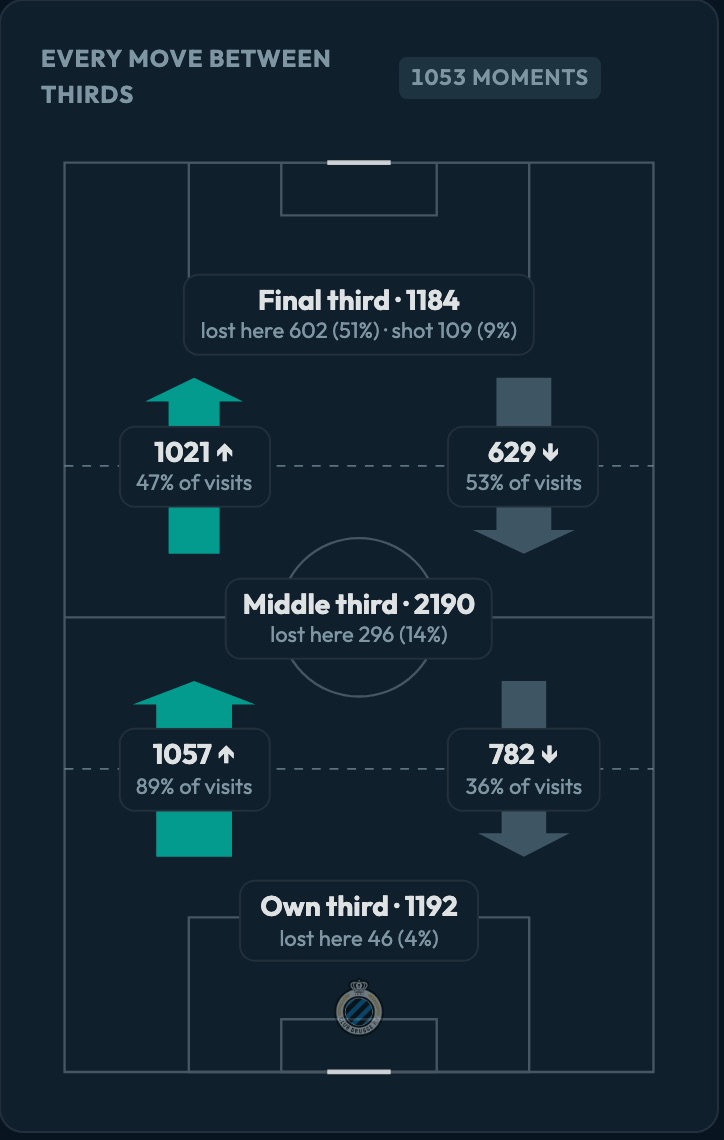
Pitch showing Club Brugge's moves between thirds: how often the ball goes up, drops back, or is lost in each third

02 · Third by third

Getting out is easy for them. The middle third is where it turns.

Each time the ball is in a third, the report counts what happens next. From their own third Club Brugge move up on 89% of visits and lose it there on 4%. In the middle third 47% of visits go on to the final third and 36% drop back. In the final third 9% end in a shot and 51% are lost.

It is the picture a coach draws on the board: up, back, lost. The same moments are then split by the opponent's block and by the score. Against a low block, 67% are lost in the final third; against a high block, 44%. That tells you what sitting deep against them costs, and what it buys.

03

2 and 3 in the back line

One real tracked moment per shape, own goal at the bottom

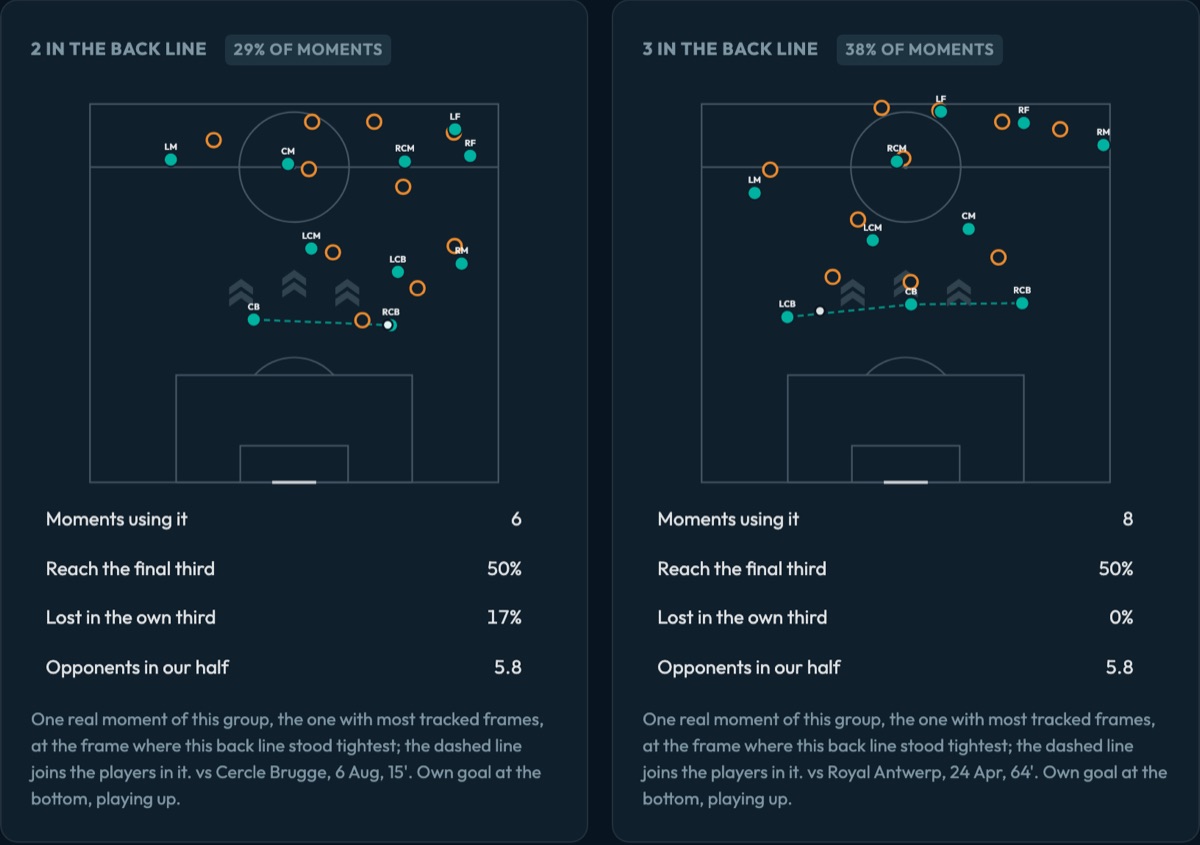
Two tracking frames of Club Brugge building up, one with 2 in the back line and one with 3, with how often each reaches the final third

03 · The shape they build in

Not the team sheet. How many really stay back.

With tracking, the report counts how many Club Brugge keep in the back line while the ball is in their own third, outside the box. They build with 3 most often, 38% of the tracked moments, and with 2 on 29%. Each card is one real moment, at the frame the line stood tightest, and the dashed line joins the players in it.

The report is open about the sample: tracking covers 21 of 403 own-third moments in this window, so these cards are a sketch to check, not a verdict. Every card names its match and minute, like Royal Antwerp on 24 April in the 64th, so your analyst can go straight to the moment.
04

Where the ball crosses into the next third

Every pass or carry from one third into the next, by side

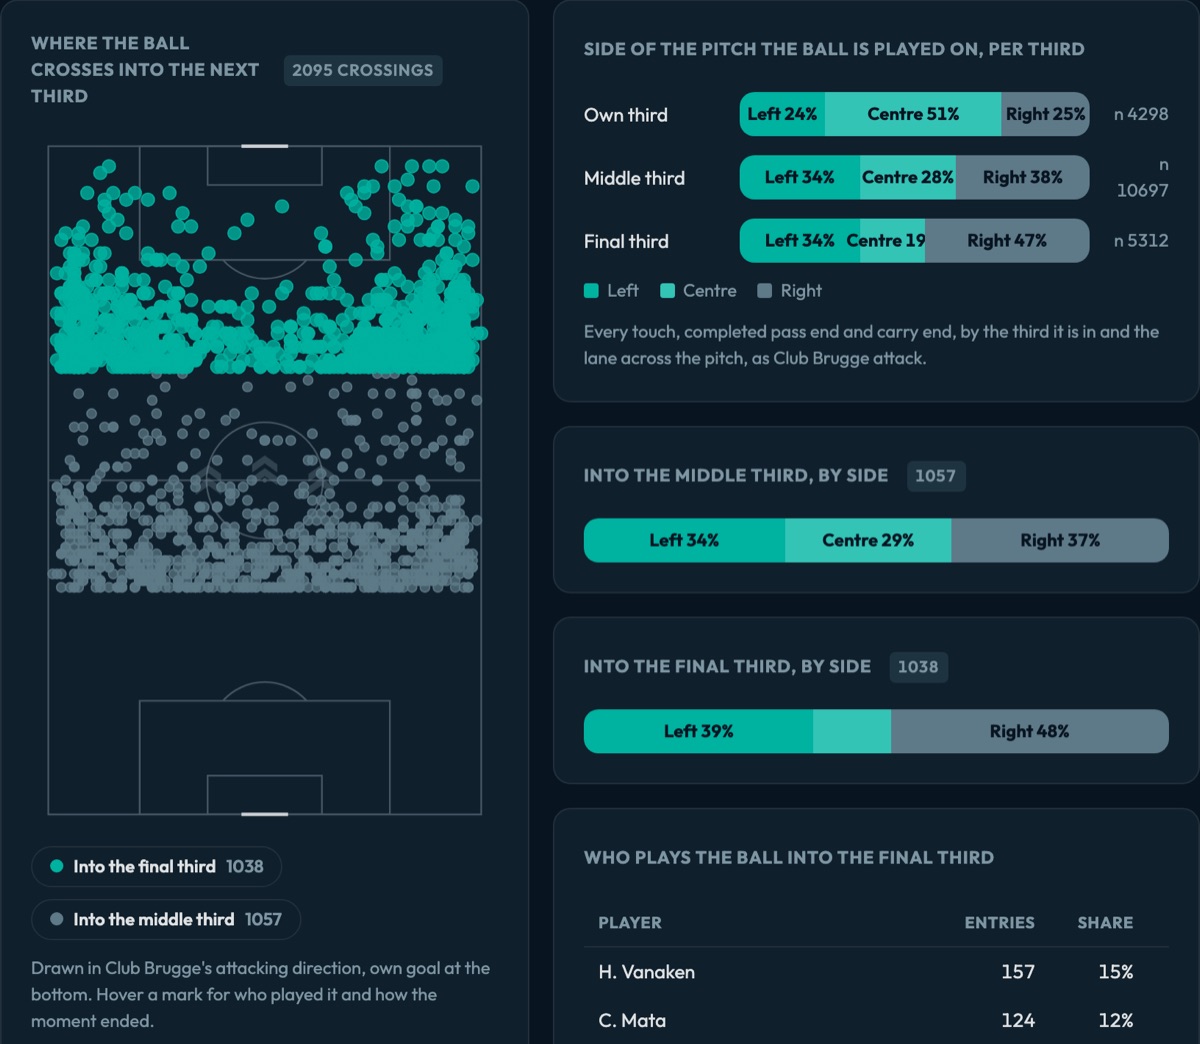
Pitch of Club Brugge's 2095 crossings into the next third, next to bars for the side of the pitch per third and the players who play the ball into the final third

04 · Left, centre or right

Through the middle at the back, then down the right.

In their own third the ball is mostly in the centre, 51%. From there Club Brugge go wide: the ball leaves the own third mostly down the right, 37%, and enters the final third on the right 48% of the time, against 39% on the left. H. Vanaken plays it in most, 157 entries and 15% of them, then C. Mata with 124.

That is a flank and a name to build your block around. The pitch beside the bars marks all 2095 crossings into the next third, drawn in Club Brugge's attacking direction, so the pattern is there to see before anyone reads a percentage.

05

Own-third build-ups that never left the own third

17 opponents with at least 5 own-third moments, against how everyone else fared

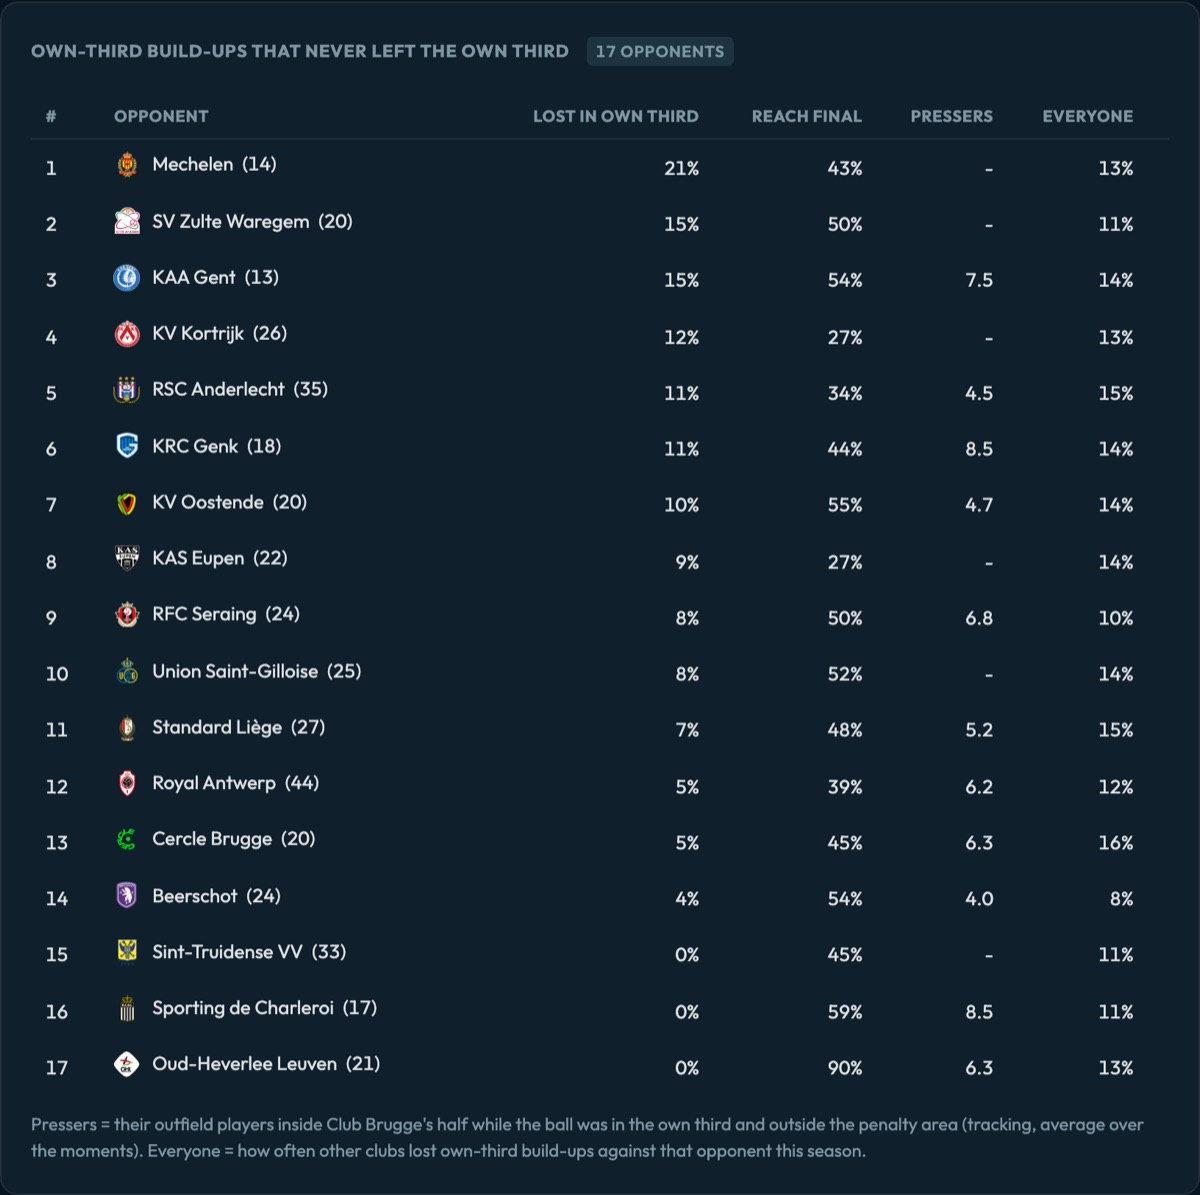
Table of 17 opponents ranked by how often Club Brugge's own-third build-ups never left the own third against them, with Mechelen first

05 · Who pressed best

Who got at them, and whether that was about Club Brugge.

Mechelen pressed Club Brugge best: 21% of own-third build-ups against them never left the own third, against 8% for Club Brugge over the season, and only 43% reached the final third. At the other end, against Oud-Heverlee Leuven 0% were lost early and 90% reached the final third.

The Everyone column is the check. Other clubs lost 13% against Mechelen, the league-wide figure, so Mechelen did not press everyone like this: they found something against this build-up. That is the press worth studying before you face them.

06

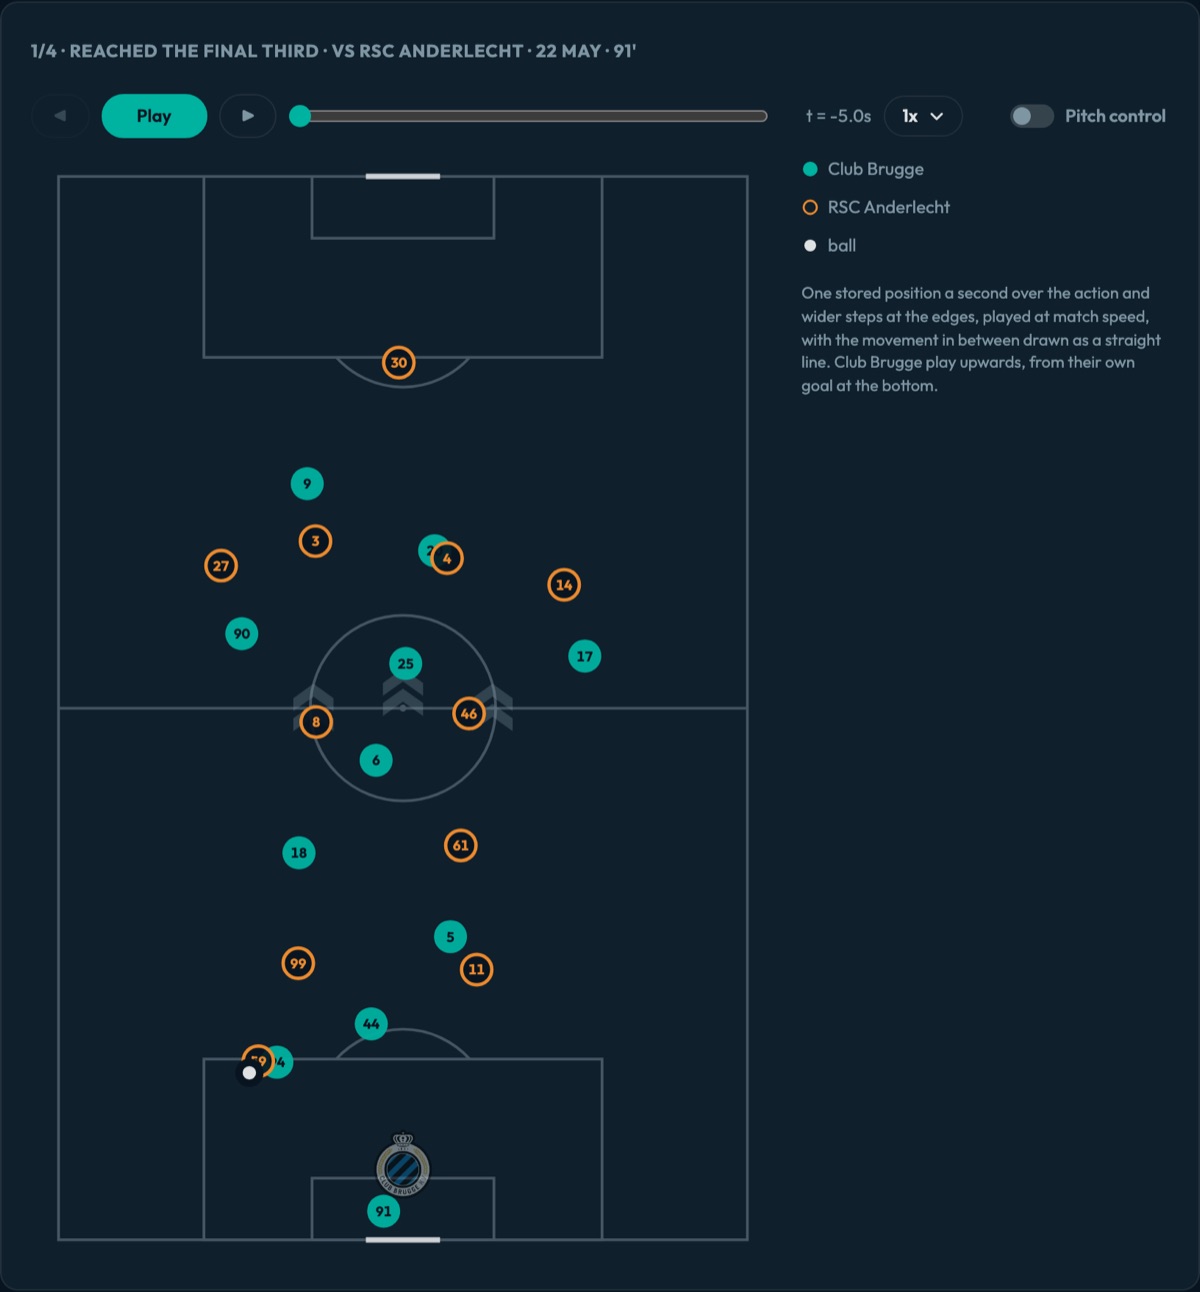
Reached the final third · vs RSC Anderlecht · 22 May · 91'

One stored position a second, played at match speed

Tracking replay of a Club Brugge build-up against RSC Anderlecht, both teams' players on the pitch with the ball near Club Brugge's box

06 · Moments in motion

Two that worked, two that broke, replayed from tracking.

The report ends on real own-third build-ups replayed from tracking: the most recent two that reached the final third and the most recent two lost inside the own third, from the first settled pass to fifteen seconds after. This one is against RSC Anderlecht on 22 May, in the 91st minute, and it got through.

Every number above comes back to moments like these. You see how the players actually stood and moved, at match speed, before any of it goes in front of the squad.

Next to this one

Opponent analysisTeam reportSeason report

Full opponent report

Context and form, a phase-by-phase read of their game ranked against the league, then the players who decide it. The pack your analysts build by hand today.

Build the full opponent report for our next opponent, last six matches.

See the template →
Opponent analysisTeam reportSeason report

Pressing report

Tactical concept

Pressing in open play and on goal kicks: the triggers, the real shape from tracking data, and the games where the press got broken most.

How aggressive do they press against short build-up?

See the template →
Opponent analysisTeam reportSeason report

Goal kicks

Tactical concept

Goal kicks by route, straight long, short then long or played out: what each one produces, and where the short build goes first.

Show their goal-kick build-up and how teams press it.

See the template →

All templates →

Same report, your club's data.

Create an account on the live platform and run this template on your own club.

Try for free