Opponent analysisTeam reportSeason report

Their whole game, in one report.

The whole pack in one question: who they are right now, how they play phase by phase against the rest of the league, and the players who decide it. It is the report your staff assembles by hand every week, in the structure they already use.

Watch the full report ↗

Opens the real report on open data: Club Brugge, Belgian Pro League 2021/22. No account needed.

The prompt behind it

Build the full opponent report on Club Brugge: their 2021/22 league season, phase by phase, and the players who decide it.

Change a word and you get a different report. Same template, your question.

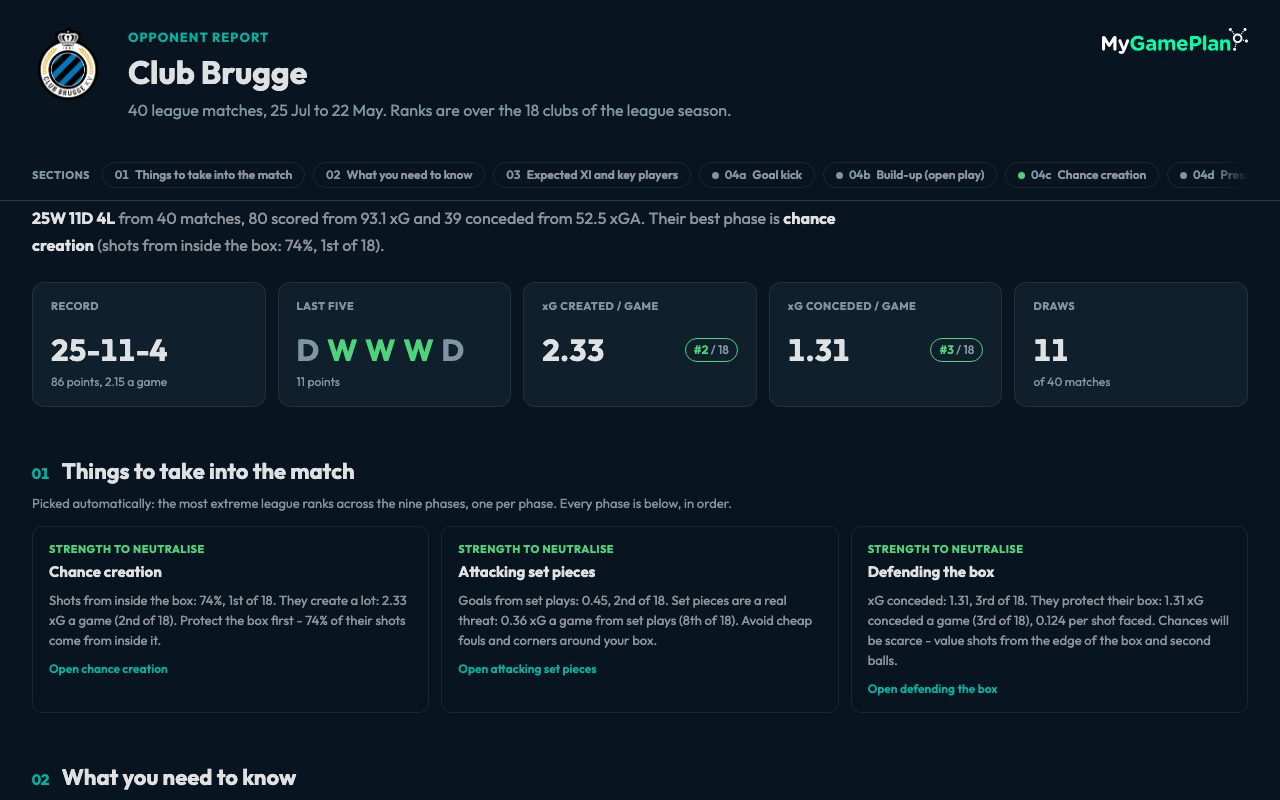
app.mygameplan.ai/try/full-opponent-reportOpen ↗Full opponent report, the first screen of the real report on Club Brugge

The report, section by section

Six sections, the way this template is written today.

Scroll down. Every number here is the real report's, on Club Brugge 2021/22, and the report itself is one click away, behind Watch the full report. Keep these six, cut the ones you never read, or prompt for another.

01

Things to take into the match

The most extreme league rank per phase, picked automatically

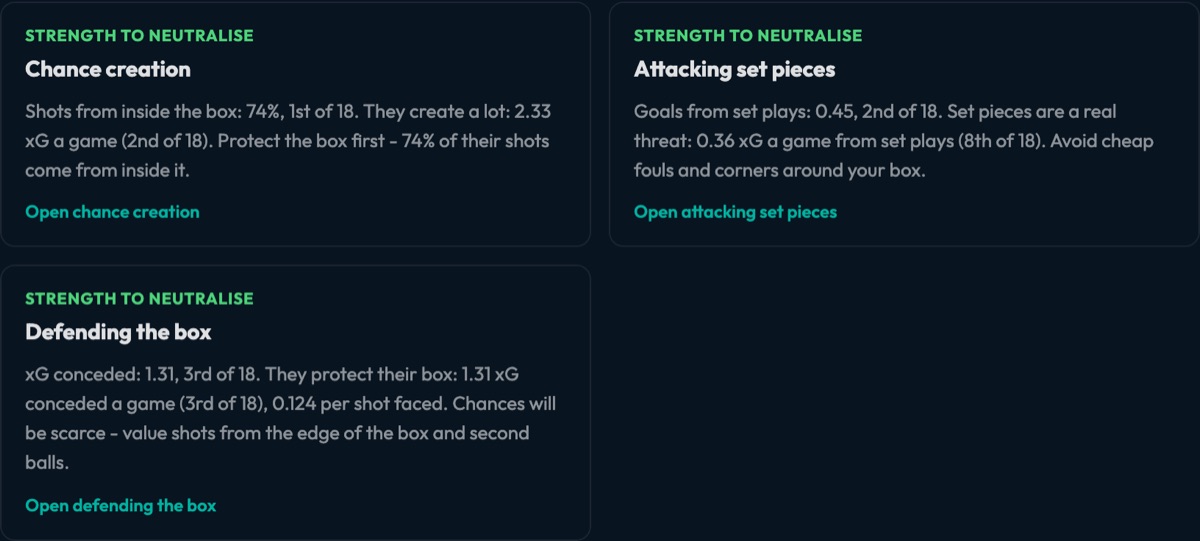
Three cards for Club Brugge: chance creation, attacking set pieces and defending the box, each a strength to neutralise with its league rank

01 · Things to take into the match

Three lines for the dressing room, before any detail.

The report opens with the most extreme league ranks across the nine phases, one per phase. For Club Brugge all three are strengths to neutralise: 74% of their shots come from inside the box (1st of 18), 0.45 goals a game from set plays (2nd of 18), and only 1.31 xG conceded a game (3rd of 18).

Each card ends with what to do about it: protect the box first, avoid cheap fouls and corners around your box, and value shots from the edge of the box and second balls. That is the start of the game plan, and every card opens the phase behind it.

02

League table

18 clubs, xG and xGA per game from the league shot benchmarks

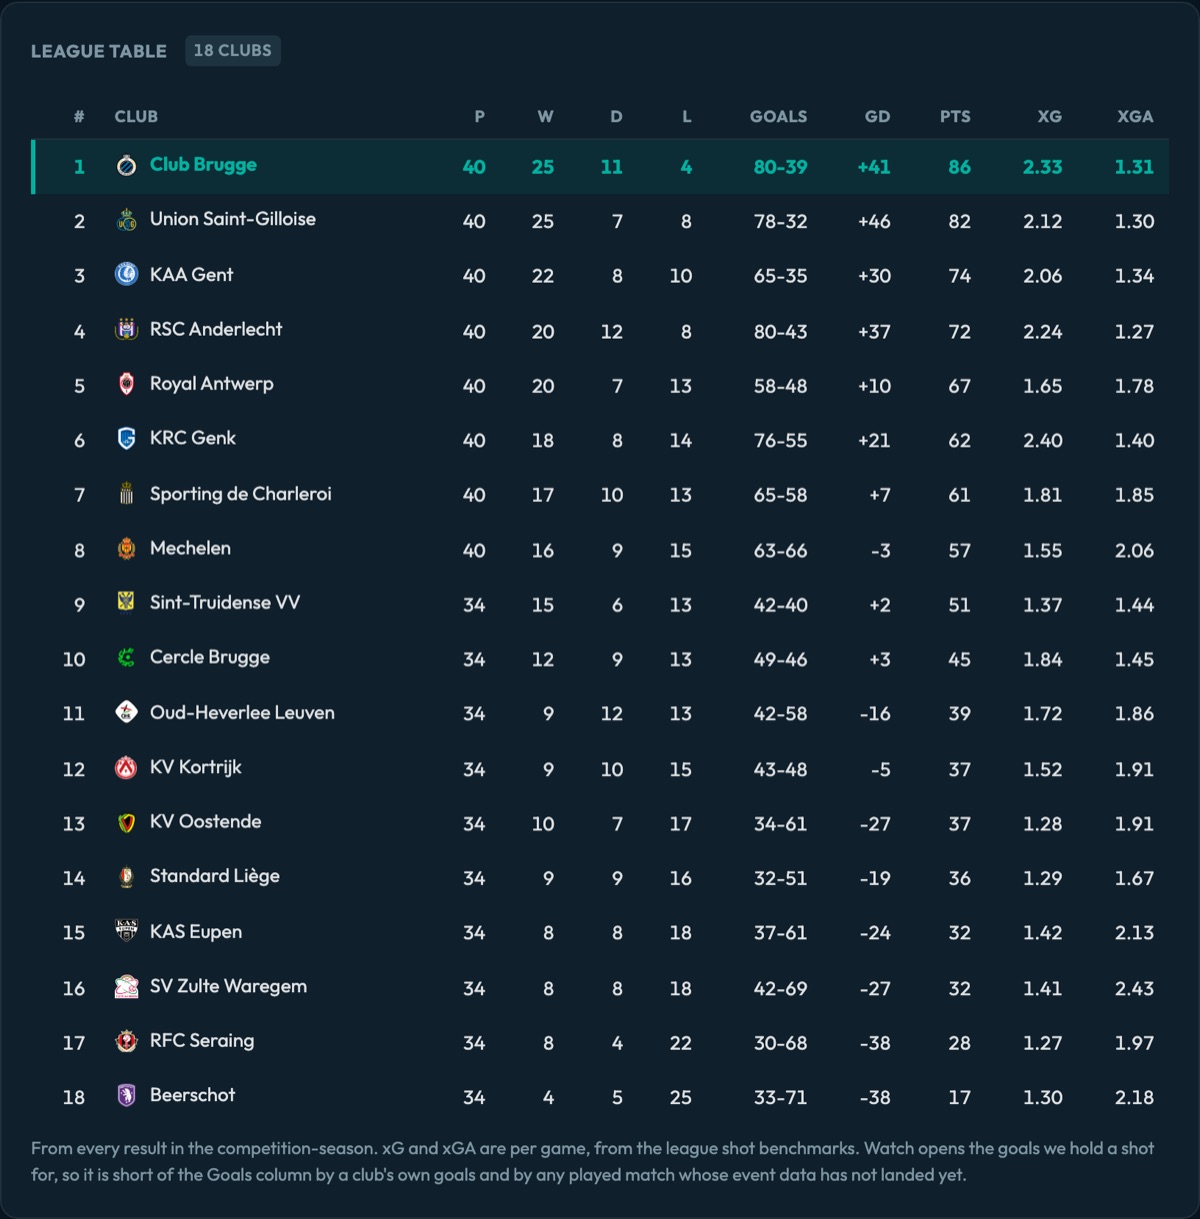
Belgian Pro League 2021/22 table with Club Brugge first on 86 points, with goals, xG and xGA per club

02 · What you need to know

Top of the table, and the numbers say it was no accident.

Club Brugge top the table after 40 matches: 25 wins, 11 draws and 4 defeats, 86 points, 80 scored and 39 conceded. Their 2.33 xG a game is matched by just 1.31 against, and the last five brought 11 points, including 2-0 and 1-0 wins over Union Saint-Gilloise, second on 82.

Before a phase is opened, the staff know who they are facing: a side that creates at the top of the league and gives little away. The same section carries their form, home and away split and average positions.

03

Key players

The players that matter this window, one role each

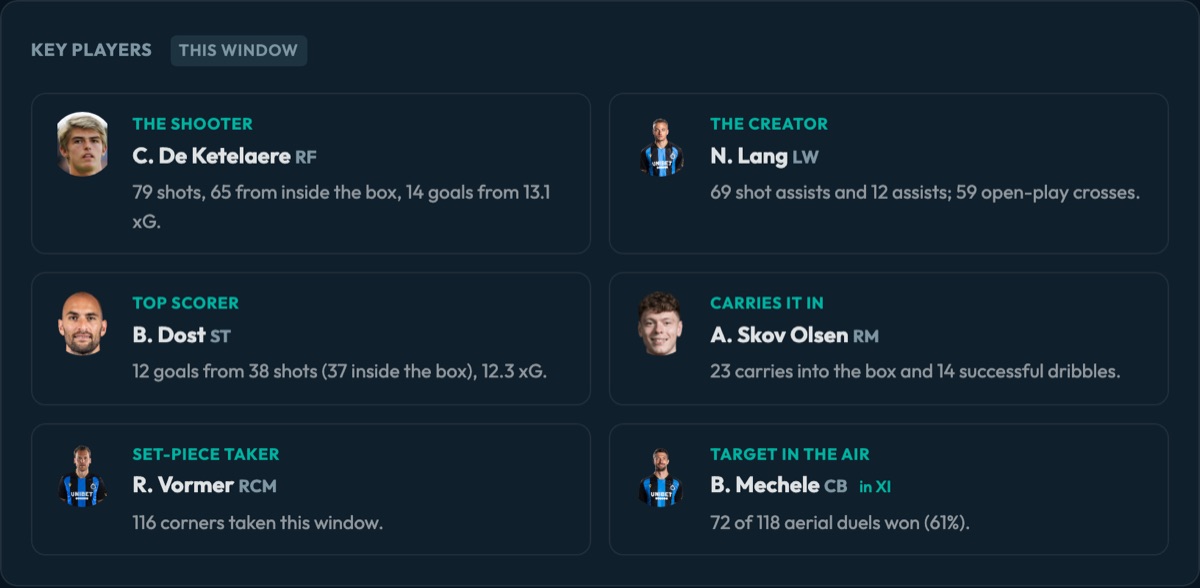
Key players of Club Brugge: De Ketelaere, Lang, Dost, Skov Olsen, Vormer and Mechele, each with a role and the numbers behind it

03 · Key players

Six names, each with the reason you need to know them.

The individual section names the players that matter, each with a role. C. De Ketelaere is the shooter: 79 shots, 65 from inside the box, 14 goals from 13.1 xG. N. Lang is the creator with 69 shot assists and 12 assists. B. Dost scored 12 from 38 shots, R. Vormer took 116 corners and B. Mechele won 72 of 118 aerial duels.

That is the briefing for your back line and your midfield in one panel: who shoots, who supplies, who delivers the dead ball and who attacks it. It sits next to their expected eleven and the substitutes they use most.

04

Shots by player

Shots, shots in the box, goals and xG per player, with where the shots come from

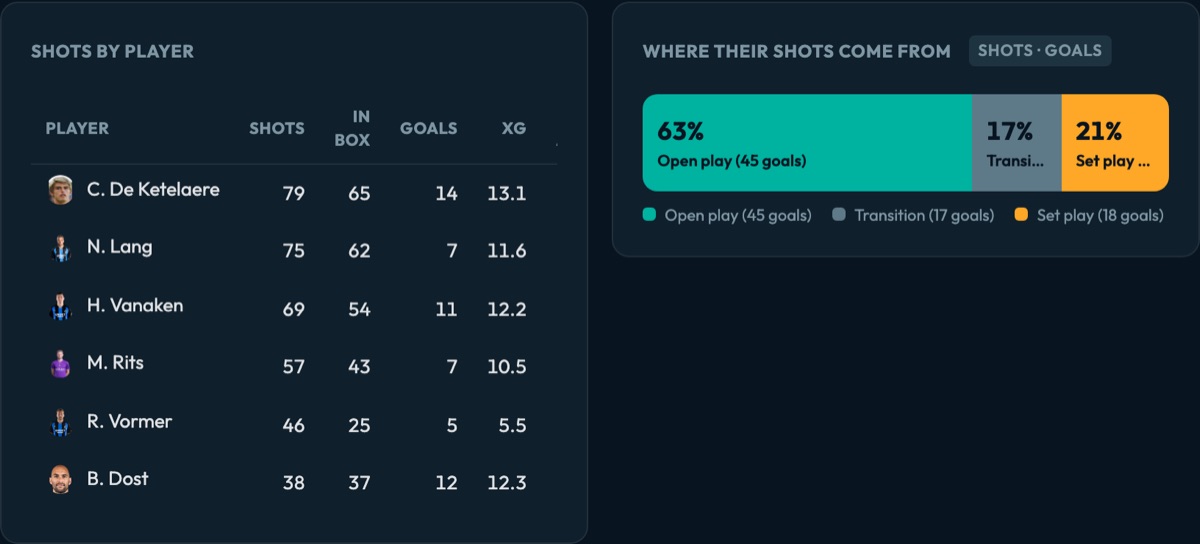
Club Brugge shots by player, led by De Ketelaere with 79, and the split of their shots across open play, transition and set play

04 · Chance creation

They do not shoot from range. They get into the box.

Chance creation is their strength: 2.33 xG a game (2nd of 18), 14.8 shots, 0.158 xG per shot, and 74% of shots from inside the box against a league average of 63%. De Ketelaere took 65 of his 79 inside it, Dost 37 of 38. Open play gives 63% of their shots and 45 goals, set plays 21% and 18 goals.

So the question for your defence is not whether to block shots from distance, it is how to stop entries into the box. The report hands you the shooters by name and the phase each goal came from.

05

Who wins it high

Regains in the opponent half, against all regains

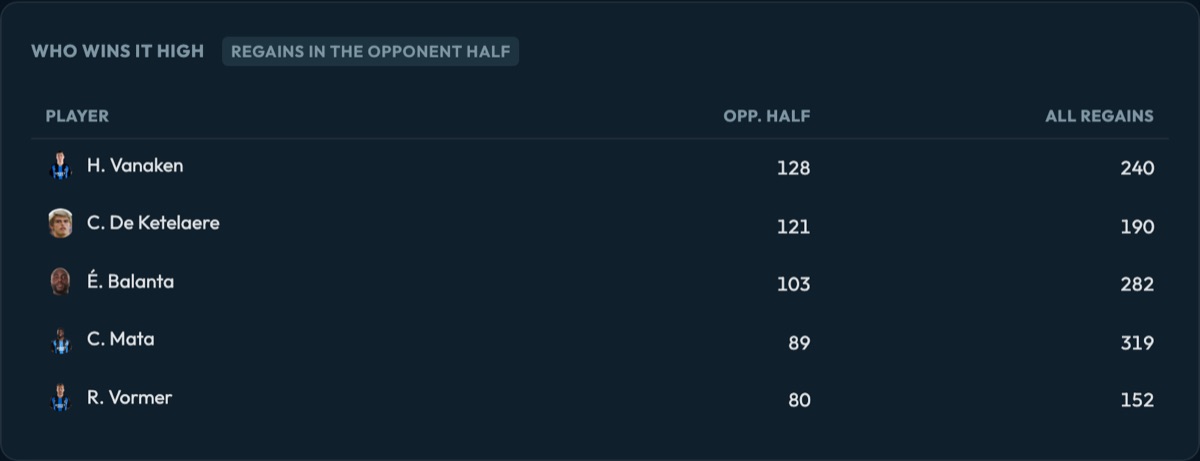
Club Brugge players ranked by regains in the opponent half, with Vanaken on 128 and De Ketelaere on 121

05 · Offensive transition

Lose it near Vanaken and De Ketelaere, and they go.

When they win it back, Club Brugge produce 0.40 xG a game from transitions (5th of 18). The regains start high: H. Vanaken won the ball 128 times in the opponent half, C. De Ketelaere 121.

The report turns that into a rule for your shape: rest defence over numbers in attack, keep three behind the ball and do not send both full-backs. And protect the pass into midfield when those two are near.

06

Takers and targets

Corners taken, aerials won and goals per player

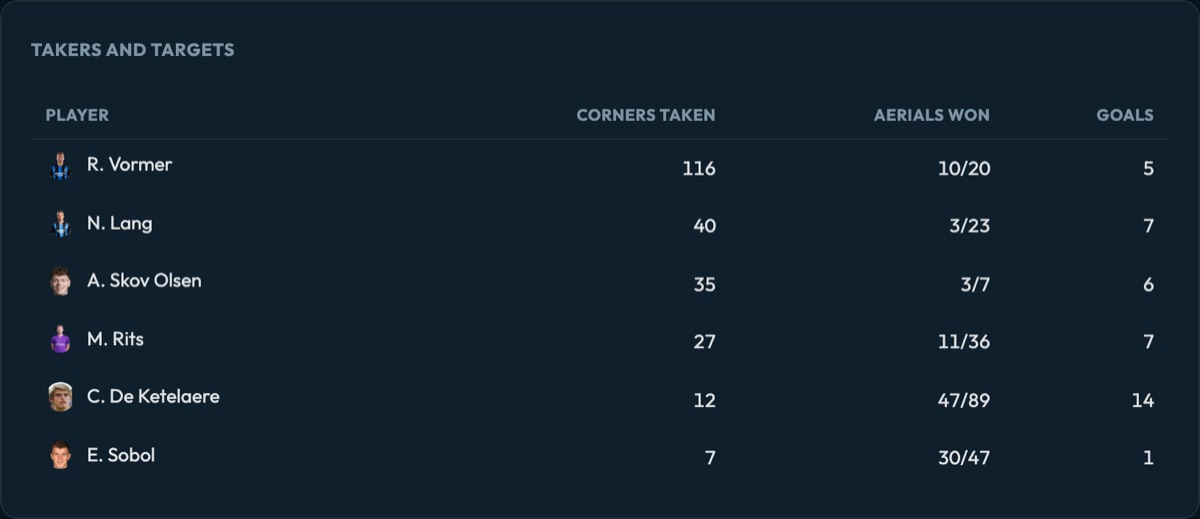
Club Brugge set-piece takers and targets: corners taken, aerials won and goals per player, led by Vormer with 116 corners

06 · Attacking set pieces

One taker, several targets, and goals to show for it.

Set plays bring Club Brugge 0.45 goals a game (2nd of 18) and 0.27 xG in the seven seconds after a corner (2nd of 18, league average 0.19). R. Vormer takes the corners, 116 of them, and C. De Ketelaere won 47 of 89 aerials.

That tells your set-piece coach who to mark and who to stop at the source. The advice is in the report too: avoid cheap fouls and corners around your box.

Next to this one

Opponent analysisTeam reportSeason report

Pressing report

Tactical concept

Pressing in open play and on goal kicks: the triggers, the real shape from tracking data, and the games where the press got broken most.

How aggressive do they press against short build-up?

See the template →
Opponent analysisTeam reportSeason report

Goal kicks

Tactical concept

Goal kicks by route, straight long, short then long or played out: what each one produces, and where the short build goes first.

Show their goal-kick build-up and how teams press it.

See the template →
Opponent analysisTeam reportSeason report

Build-up in open play

Tactical concept

Build-up shapes from tracking data, the routes out, and where the ball is actually lost.

Break down their build-up shapes and where they lose the ball.

See the template →

All templates →

Same report, your club's data.

Create an account on the live platform and run this template on your own club.

Try for free