Full opponent report
Context and form, a phase-by-phase read of their game ranked against the league, then the players who decide it. The pack your analysts build by hand today.
Build the full opponent report for our next opponent, last six matches.
The seconds after the ball changes hands, both ways. How direct they go, who runs, which lane they enter the final third through, whether the shots are worth taking, and what their counter-press does when it goes the other way.
Watch the full report ↗Opens the real report on open data: Club Brugge, Belgian Pro League 2021/22. No account needed.
The prompt behind it
When Club Brugge win the ball back, what happens next, and which breaks turn into shots?
Change a word and you get a different report. Same template, your question.

The report, section by section
Scroll down. Every number here is the real report's, on Club Brugge 2021/22, and the report itself is one click away, behind Watch the full report. Keep these five, cut the ones you never read, or prompt for another.
The funnel · First action off the regain
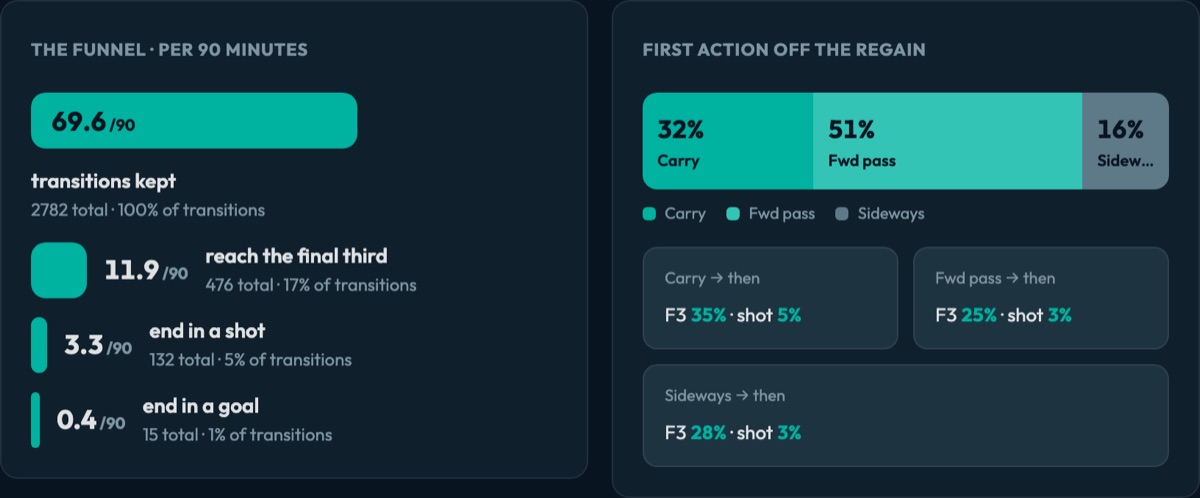
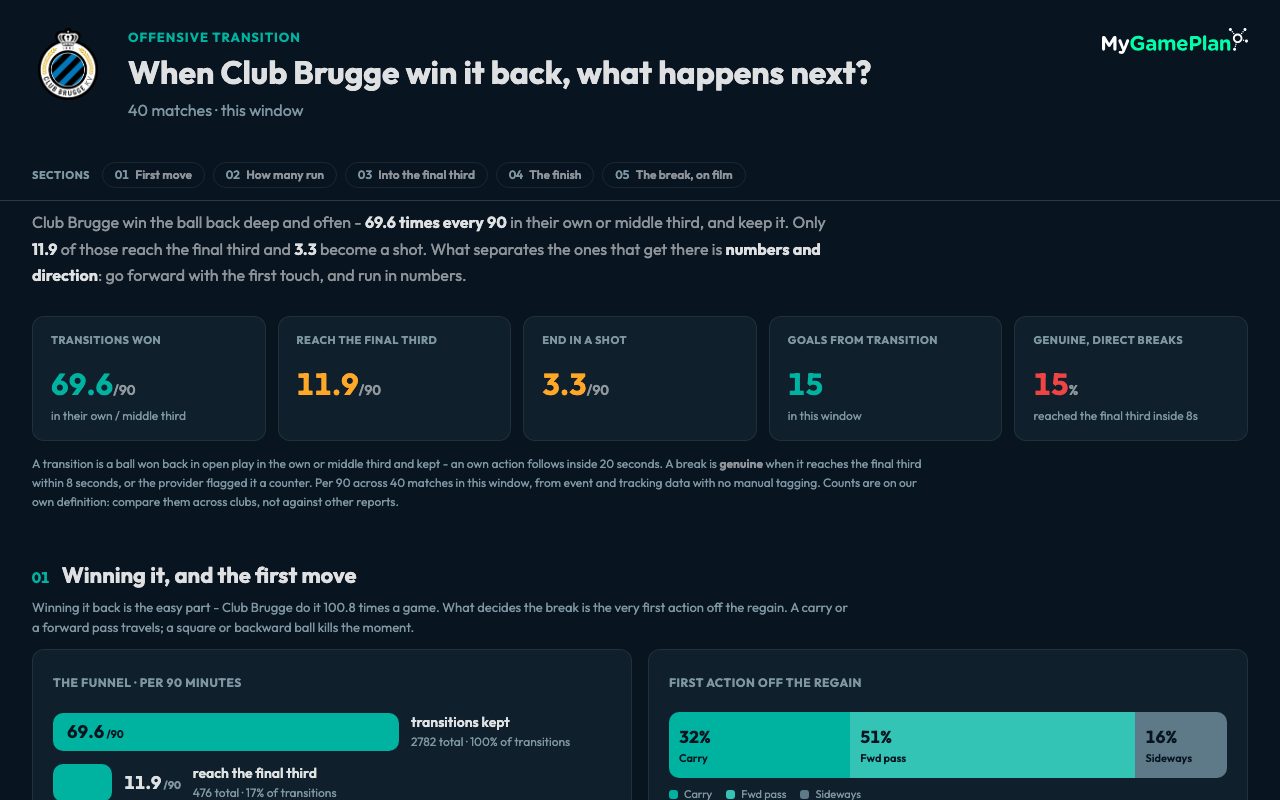
Per 90 across 40 matches, and how far each first action gets

01 · The first move
Club Brugge win the ball back and keep it 69.6 times every 90 in their own or middle third. Only 11.9 of those reach the final third and 3.3 end in a shot. The report then splits every regain by its first action: 32% are carries, 51% forward passes and 16% go sideways. A carry reaches the final third 35% of the time, against 28% for a sideways ball.
That turns a vague idea, be braver on the ball, into names. B. Mechele drives it forward on 345 of his 409 first actions, while the squad's square balls are listed player by player, so the conversation on the training pitch is about specific habits, not the team in general.
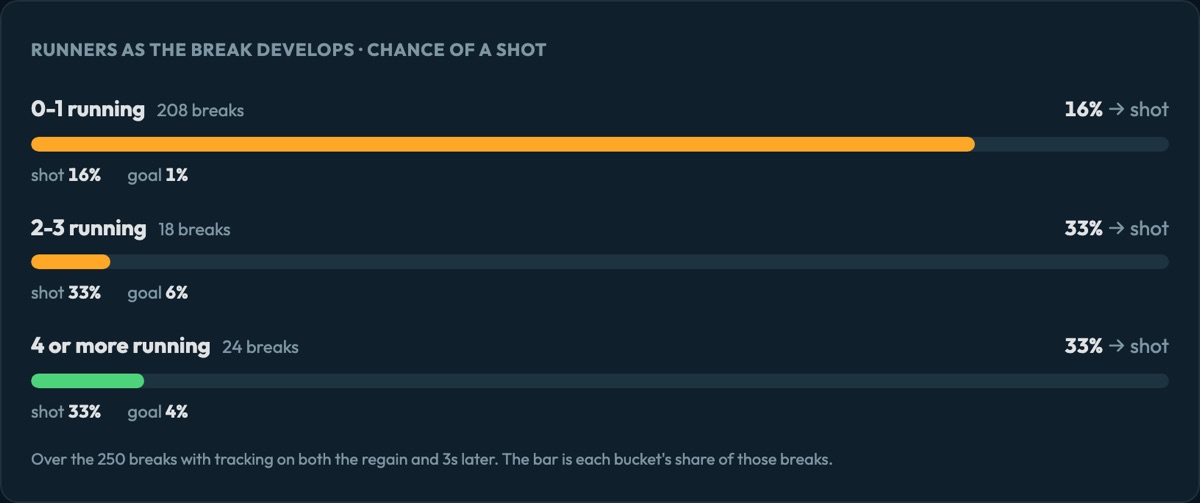
Runners as the break develops · Chance of a shot
The 250 breaks with tracking on the regain and 3s later

02 · How many run
From tracking, the report counts how many Club Brugge players are really running forward in the 3 seconds after the regain. With 0-1 runners a break becomes a shot 16% of the time, on 208 breaks. With four or more it is 33%, 2.1 times as likely, but that happens on only 24 breaks.
The picture is clear: most of their breaks are run by one player or none. The report names who should run more, attackers and midfielders below the 10% squad median, such as D. Odoi at 8% (13 of 154). That is a concrete ask for the next session, backed by the tracking.
Into the final third
Shot rate per entry lane, and each lane's share of entries

03 · Into the final third
Once a break reaches the final third, the report counts where it entered. Club Brugge go through the centre on only 16% of entries, yet those produce a shot 23% of the time, against 12% down the left and 9% down the right.
That is the lever, stated in one panel: the break is being pushed away from the lane that pays. The report also lists who finds the middle, C. De Ketelaere with 19 of 93 entries central, and who is pushed wide, so a staff can see whether it is a pattern or a few players.
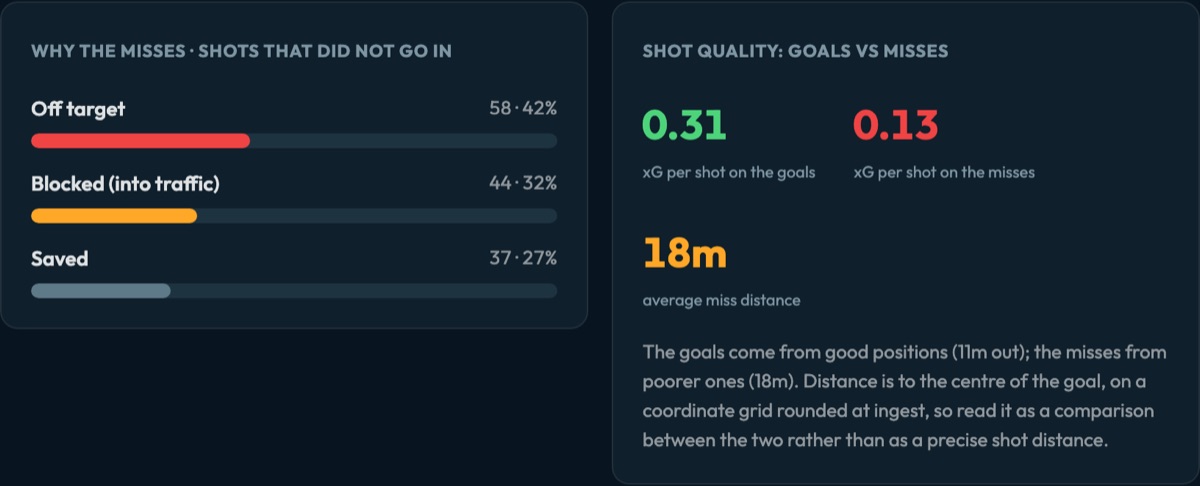
Why the misses · Shot quality: goals vs misses
Shots from transition that did not go in, and xG per shot

04 · The finish
The shots from transition that went in were worth 0.31 xG each; the ones that did not were worth 0.13. The goals came from 11m out, the misses from 18m, and 42% of the misses were off target.
So the answer is not more finishing drills, it is getting the ball closer before shooting, through the middle as section 03 showed. The report names the players who shoot from too far, K. Sowah on 23m across 6 shots, next to the ones who create the most, with N. Lang on 4.20 xG.
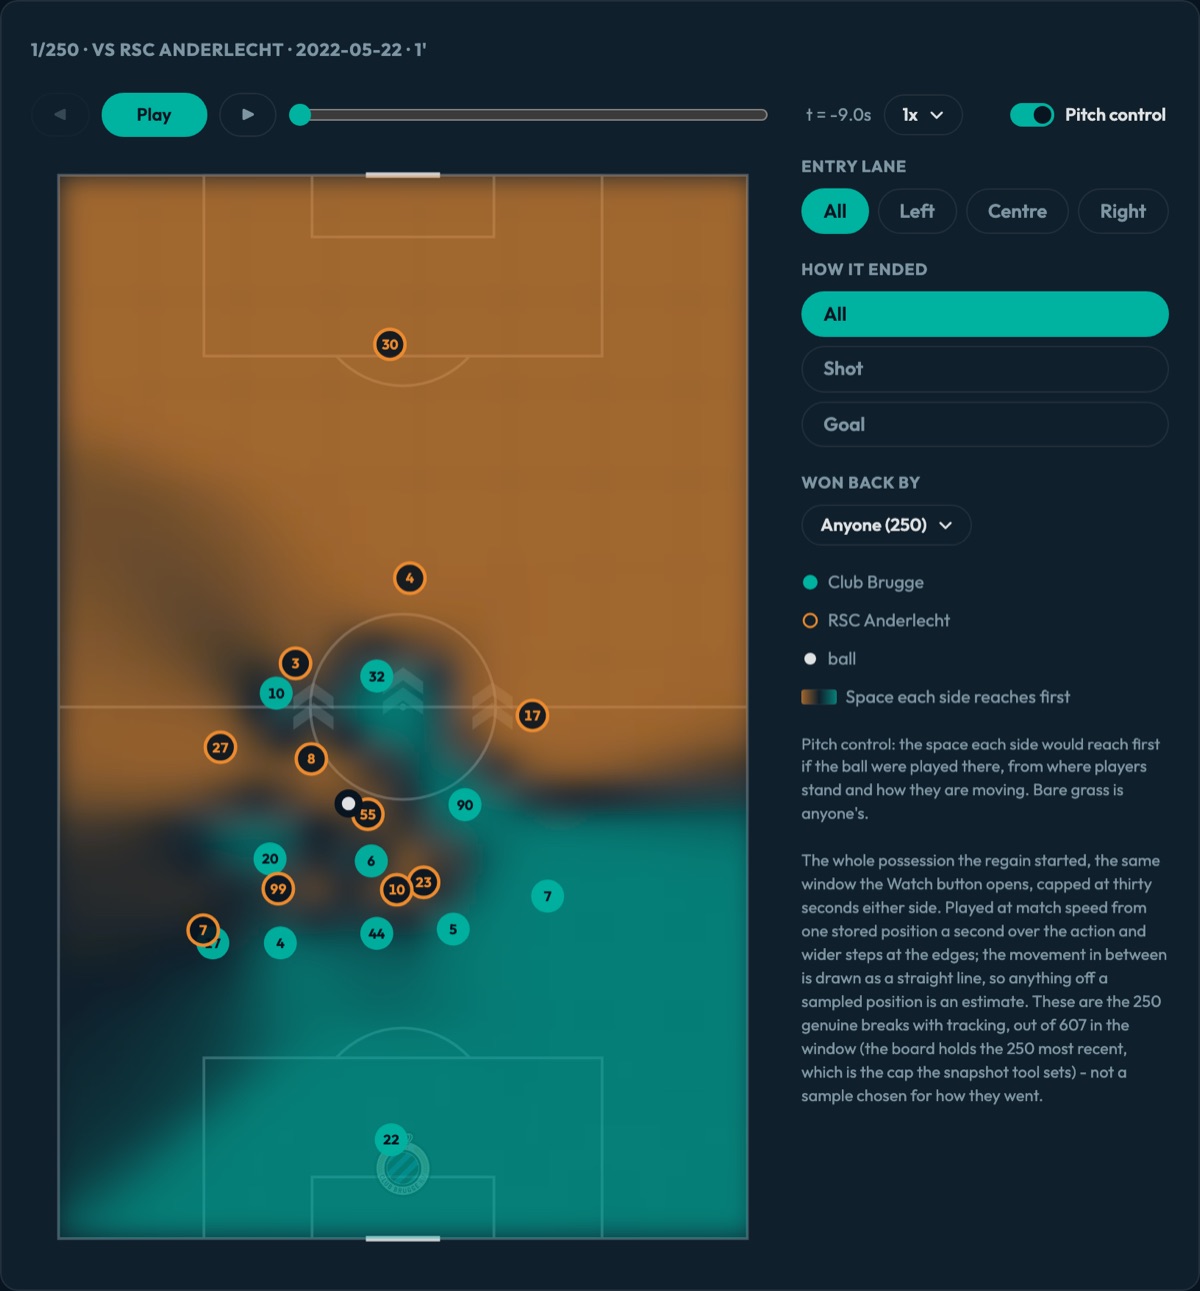
The break, replayed
Tracking replay with pitch control, filterable by lane and outcome

05 · The break, replayed
The last section replays the breaks themselves: the 250 genuine breaks with tracking, out of 607 in the window, played at match speed with pitch control showing the space each side reaches first. This one starts against RSC Anderlecht.
Filter by the lane it entered through, by whether it ended in a shot or a goal, and by who won the ball back. Every number above comes back to moments like this one, so the staff judges the break, not just the rate.
Context and form, a phase-by-phase read of their game ranked against the league, then the players who decide it. The pack your analysts build by hand today.
Build the full opponent report for our next opponent, last six matches.
Pressing in open play and on goal kicks: the triggers, the real shape from tracking data, and the games where the press got broken most.
How aggressive do they press against short build-up?
Goal kicks by route, straight long, short then long or played out: what each one produces, and where the short build goes first.
Show their goal-kick build-up and how teams press it.
Create an account on the live platform and run this template on your own club.
Try for free